Author
Eurachem
Eurachem
Eurachem is a European network promoting international traceability of chemical measurements and good analytical practice. It provides expert guidance, supports method validation, uncertainty evaluation, proficiency testing, and facilitates discussion on technical and policy issues in analytical quality.
Tags
Article
Academy
LinkedIn Logo

Using repeated measurements to improve the standard uncertainty
Tu, 28.7.2026
| Original article from: Eurachem
Learn when repeated measurements reduce standard uncertainty, when Equation (1) applies, and how to correctly evaluate uncertainty for grouped, correlated, and time-dependent analytical data.
<p>Eurachem: Using repeated measurements to improve the standard uncertainty</p>

Eurachem: Using repeated measurements to improve the standard uncertainty

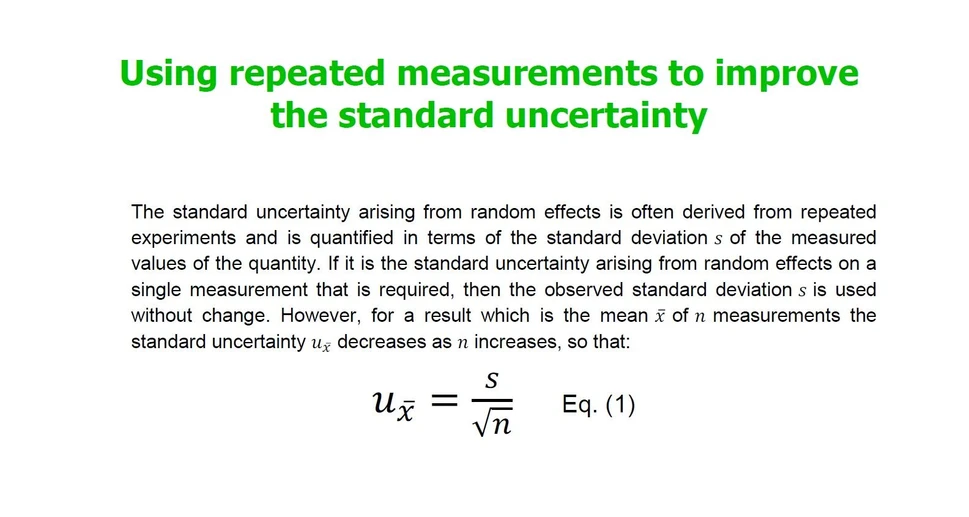
The standard uncertainty arising from random effects is often derived from repeated experiments and is quantified in terms of the standard deviation s of the measured values of the quantity. If it is the standard uncertainty arising from random effects on a single measurement that is required, then the observed standard deviation s is used without change. However, for a result which is the mean x of n measurements the standard uncertainty decreases as n increases, so that:
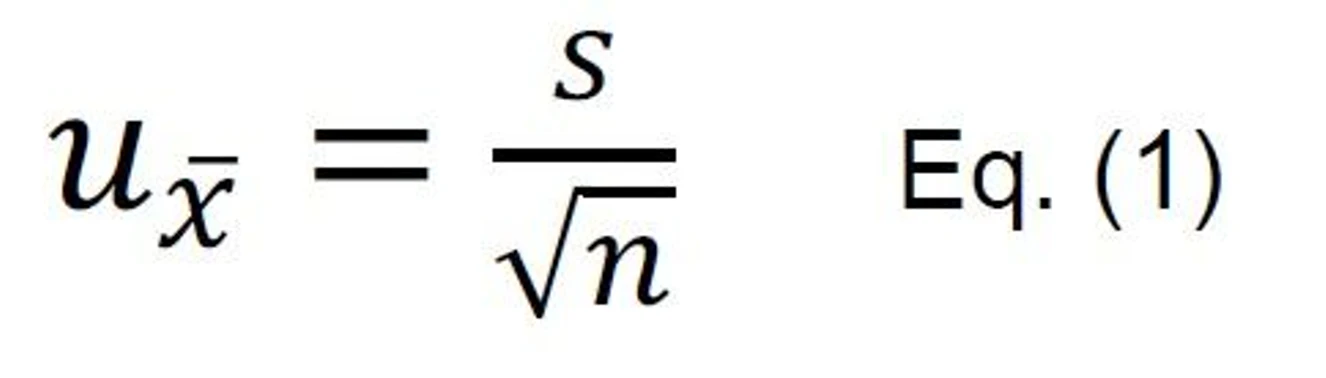
Eurachem: Using repeated measurements to improve the standard uncertainty - Equation 1Eurachem: Using repeated measurements to improve the standard uncertainty - Equation 1

Example 1 shows how Eq (1) applies when estimating the uncertainty of a mean value, but not when considering the uncertainty of individual observations.

Example 1 A volumetric pipette is calibrated with 12 measurements; the mean and the standard deviation are calculated. Eq. 1 applies to estimate the standard uncertainty of the mean value. However, when using the pipette to deliver one aliquot, Eq. 1 does not apply and the standard uncertainty due to random variation on this single measurement is the standard deviation s

For Eq (1) to be valid, it is a requirement that all the measurements are independent and from a stable test sample under the same measurement conditions. The measurement conditions for all the measurements could be, for example, 1) repeatability conditions, 2) intermediate precision (within laboratory reproducibility) conditions or 3) reproducibility conditions 

It is very important to be aware that the standard uncertainty given by Eq. 1 only gives the estimated uncertainty due to random variation under the conditions of measurement under which the observations were taken, and is only strictly valid for independent observations. 

It can be hard to decide whether observations are sufficiently independent for Eq. 1 to apply, as there is no simple, general, rule. The following paragraphs therefore give examples of different circumstances to help identify circumstances when Eq. 1 can safely be used.

Example where Equation (1) applies 

Measurement of inhomogeneous samples 

If inhomogeneity for test samples is a major part of the uncertainty the analyst may choose to measure more test portions from each test sample in order to reduce the standard uncertainty. If all these measurements are made under repeatability conditions, i.e. the same measurement conditions following the whole procedure, including repeated random sampling from the test sample, the standard deviation of the mean, given by Eq. (1), should be used to estimate the uncertainty arising from variation under repeatability conditions. 

Examples where Equation (1) does not apply 

The following paragraphs give two examples where neither the standard deviation nor the standard deviation of the mean can be directly applied without further analysis of the data. 

Measurements taken in groups 

One example is when we have data from internal quality control from a measurement procedure that includes a calibration before analysis each day. We want to calculate the standard uncertainty of the mean value used to set the central line in the QC chart. The data consist of duplicate QC measurements performed on a stable test sample each day over a longer period of time (say, p days), giving a total of 2p observations; that is, p groups of two measurements. Because each pair of duplicate measurements has a single calibration error in common; the duplicates within the data set are not strictly independent and Eq. (1) cannot be directly used for all 2p observations. The uncertainty of the mean can most easily be calculated by taking the standard deviation of the p means for each day and dividing that standard deviation by √p . Analysis of variance can also be useful in similar cases. Similar principles apply to other kinds of grouping, including grouping by operator, instrument etc. 

Measurement when the test item or measurement system is not stable over time

Another common example is time dependent data. The time dependence could be due to instrument drift or to actual change in concentration by time. In such cases the error for a given observation is partly random and in part ‘carried over’ from the previous observation. Again the errors affecting each observation are not independent because some part of the error is common to successive observations; Eq. (1) can not be used and more complex statistical techniques, that allow for correlation, must be used to process the data. 

For further guidance on the treatment of correlated data in uncertainty evaluation, see Eurolab Technical Report 1/2006: Guide to the Evaluation of Measurement Uncertainty for Quantitative Test Results, Appendix A.5

Eurachem
LinkedIn Logo
 

Related content

Impurity Monitoring of GLP-1 Therapeutic Peptide RetatrutideUsing a 2D-LC/TOF System

Posters
| 2026 | Agilent Technologies (ASMS)
Instrumentation
LC/MS, LC/MS/MS, LC/TOF, LC/HRMS, 2D-LC
Manufacturer
Agilent Technologies
Industries
Pharma & Biopharma

Increased sensitivity for low-input label-free proteomics using the Orbitrap Astral MS and μPAC Neo Plus Columns

Applications
| 2026 | Thermo Fisher Scientific
Instrumentation
LC/HRMS, LC/Orbitrap, LC/MS, LC/MS/MS
Manufacturer
Thermo Fisher Scientific
Industries
Proteomics

Mind the pressure in preparative up-scaling – effects of particle size and solvent composition on back pressure

Technical notes
| 2026 | KNAUER
Instrumentation
HPLC, Consumables, LC columns
Manufacturer
KNAUER
Industries
Other

Two-Step Matrix Deposition for Improved MS Imaging Resolution

Posters
| 2026 | Shimadzu (ASMS)
Instrumentation
LC/MS, LC/MS/MS, LC/TOF, LC/HRMS, MALDI, MS Imaging
Manufacturer
Shimadzu
Industries
Pharma & Biopharma

Smart Monitoring & Optimization Solutions for SMB Processes: In-Line and Off-Line Tools for SMB Systems

Technical notes
| 2026 | KNAUER
Instrumentation
HPLC
Manufacturer
KNAUER
Industries
Pharma & Biopharma
 

Related articles

Best practices and tools in R and Python for statistical processing and visualization of lipidomics and metabolomics data
Scientific article | Science and research

Best practices and tools in R and Python for statistical processing and visualization of lipidomics and metabolomics data

The review compiles R and Python tools for analyzing lipidomics and metabolomics data, guiding beginners to create publication-ready graphics and enabling robust, reproducible chemometric analysis.
LabRulez
tag
share
more
VaMPIS - Validation of Measurement Procedures that Include Sampling
Article | Academy

VaMPIS - Validation of Measurement Procedures that Include Sampling

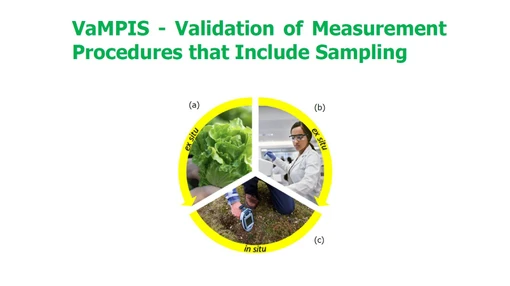
Eurachem/CITAC VaMPIS guidance introduces validation of measurement procedures that include sampling, using measurement uncertainty to assess fitness for purpose in both in situ and ex situ measurements.
Eurachem
tag
share
more
Understanding PT statistics
Article | Academy

Understanding PT statistics

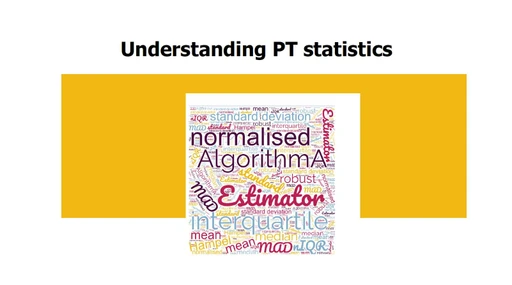
Learn how proficiency testing providers calculate assigned values, uncertainty, and data dispersion, and how these statistics help laboratories interpret PT results correctly.
Eurachem
tag
share
more
Understanding PT performance assessment
Article | Academy

Understanding PT performance assessment

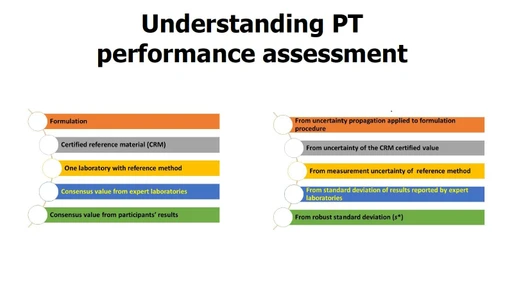
Learn how proficiency testing providers assign reference values, estimate uncertainties, calculate performance scores, and interpret z, zeta, En, and percentage difference results.
Eurachem
tag
share
more
 

Related content

Impurity Monitoring of GLP-1 Therapeutic Peptide RetatrutideUsing a 2D-LC/TOF System

Posters
| 2026 | Agilent Technologies (ASMS)
Instrumentation
LC/MS, LC/MS/MS, LC/TOF, LC/HRMS, 2D-LC
Manufacturer
Agilent Technologies
Industries
Pharma & Biopharma

Increased sensitivity for low-input label-free proteomics using the Orbitrap Astral MS and μPAC Neo Plus Columns

Applications
| 2026 | Thermo Fisher Scientific
Instrumentation
LC/HRMS, LC/Orbitrap, LC/MS, LC/MS/MS
Manufacturer
Thermo Fisher Scientific
Industries
Proteomics

Mind the pressure in preparative up-scaling – effects of particle size and solvent composition on back pressure

Technical notes
| 2026 | KNAUER
Instrumentation
HPLC, Consumables, LC columns
Manufacturer
KNAUER
Industries
Other

Two-Step Matrix Deposition for Improved MS Imaging Resolution

Posters
| 2026 | Shimadzu (ASMS)
Instrumentation
LC/MS, LC/MS/MS, LC/TOF, LC/HRMS, MALDI, MS Imaging
Manufacturer
Shimadzu
Industries
Pharma & Biopharma

Smart Monitoring & Optimization Solutions for SMB Processes: In-Line and Off-Line Tools for SMB Systems

Technical notes
| 2026 | KNAUER
Instrumentation
HPLC
Manufacturer
KNAUER
Industries
Pharma & Biopharma
 

Related articles

Best practices and tools in R and Python for statistical processing and visualization of lipidomics and metabolomics data
Scientific article | Science and research

Best practices and tools in R and Python for statistical processing and visualization of lipidomics and metabolomics data

The review compiles R and Python tools for analyzing lipidomics and metabolomics data, guiding beginners to create publication-ready graphics and enabling robust, reproducible chemometric analysis.
LabRulez
tag
share
more
VaMPIS - Validation of Measurement Procedures that Include Sampling
Article | Academy

VaMPIS - Validation of Measurement Procedures that Include Sampling

Eurachem/CITAC VaMPIS guidance introduces validation of measurement procedures that include sampling, using measurement uncertainty to assess fitness for purpose in both in situ and ex situ measurements.
Eurachem
tag
share
more
Understanding PT statistics
Article | Academy

Understanding PT statistics

Learn how proficiency testing providers calculate assigned values, uncertainty, and data dispersion, and how these statistics help laboratories interpret PT results correctly.
Eurachem
tag
share
more
Understanding PT performance assessment
Article | Academy

Understanding PT performance assessment

Learn how proficiency testing providers assign reference values, estimate uncertainties, calculate performance scores, and interpret z, zeta, En, and percentage difference results.
Eurachem
tag
share
more
 

Related content

Impurity Monitoring of GLP-1 Therapeutic Peptide RetatrutideUsing a 2D-LC/TOF System

Posters
| 2026 | Agilent Technologies (ASMS)
Instrumentation
LC/MS, LC/MS/MS, LC/TOF, LC/HRMS, 2D-LC
Manufacturer
Agilent Technologies
Industries
Pharma & Biopharma

Increased sensitivity for low-input label-free proteomics using the Orbitrap Astral MS and μPAC Neo Plus Columns

Applications
| 2026 | Thermo Fisher Scientific
Instrumentation
LC/HRMS, LC/Orbitrap, LC/MS, LC/MS/MS
Manufacturer
Thermo Fisher Scientific
Industries
Proteomics

Mind the pressure in preparative up-scaling – effects of particle size and solvent composition on back pressure

Technical notes
| 2026 | KNAUER
Instrumentation
HPLC, Consumables, LC columns
Manufacturer
KNAUER
Industries
Other

Two-Step Matrix Deposition for Improved MS Imaging Resolution

Posters
| 2026 | Shimadzu (ASMS)
Instrumentation
LC/MS, LC/MS/MS, LC/TOF, LC/HRMS, MALDI, MS Imaging
Manufacturer
Shimadzu
Industries
Pharma & Biopharma

Smart Monitoring & Optimization Solutions for SMB Processes: In-Line and Off-Line Tools for SMB Systems

Technical notes
| 2026 | KNAUER
Instrumentation
HPLC
Manufacturer
KNAUER
Industries
Pharma & Biopharma
 

Related articles

Best practices and tools in R and Python for statistical processing and visualization of lipidomics and metabolomics data
Scientific article | Science and research

Best practices and tools in R and Python for statistical processing and visualization of lipidomics and metabolomics data

The review compiles R and Python tools for analyzing lipidomics and metabolomics data, guiding beginners to create publication-ready graphics and enabling robust, reproducible chemometric analysis.
LabRulez
tag
share
more
VaMPIS - Validation of Measurement Procedures that Include Sampling
Article | Academy

VaMPIS - Validation of Measurement Procedures that Include Sampling

Eurachem/CITAC VaMPIS guidance introduces validation of measurement procedures that include sampling, using measurement uncertainty to assess fitness for purpose in both in situ and ex situ measurements.
Eurachem
tag
share
more
Understanding PT statistics
Article | Academy

Understanding PT statistics

Learn how proficiency testing providers calculate assigned values, uncertainty, and data dispersion, and how these statistics help laboratories interpret PT results correctly.
Eurachem
tag
share
more
Understanding PT performance assessment
Article | Academy

Understanding PT performance assessment

Learn how proficiency testing providers assign reference values, estimate uncertainties, calculate performance scores, and interpret z, zeta, En, and percentage difference results.
Eurachem
tag
share
more
 

Related content

Impurity Monitoring of GLP-1 Therapeutic Peptide RetatrutideUsing a 2D-LC/TOF System

Posters
| 2026 | Agilent Technologies (ASMS)
Instrumentation
LC/MS, LC/MS/MS, LC/TOF, LC/HRMS, 2D-LC
Manufacturer
Agilent Technologies
Industries
Pharma & Biopharma

Increased sensitivity for low-input label-free proteomics using the Orbitrap Astral MS and μPAC Neo Plus Columns

Applications
| 2026 | Thermo Fisher Scientific
Instrumentation
LC/HRMS, LC/Orbitrap, LC/MS, LC/MS/MS
Manufacturer
Thermo Fisher Scientific
Industries
Proteomics

Mind the pressure in preparative up-scaling – effects of particle size and solvent composition on back pressure

Technical notes
| 2026 | KNAUER
Instrumentation
HPLC, Consumables, LC columns
Manufacturer
KNAUER
Industries
Other

Two-Step Matrix Deposition for Improved MS Imaging Resolution

Posters
| 2026 | Shimadzu (ASMS)
Instrumentation
LC/MS, LC/MS/MS, LC/TOF, LC/HRMS, MALDI, MS Imaging
Manufacturer
Shimadzu
Industries
Pharma & Biopharma

Smart Monitoring & Optimization Solutions for SMB Processes: In-Line and Off-Line Tools for SMB Systems

Technical notes
| 2026 | KNAUER
Instrumentation
HPLC
Manufacturer
KNAUER
Industries
Pharma & Biopharma
 

Related articles

Best practices and tools in R and Python for statistical processing and visualization of lipidomics and metabolomics data
Scientific article | Science and research

Best practices and tools in R and Python for statistical processing and visualization of lipidomics and metabolomics data

The review compiles R and Python tools for analyzing lipidomics and metabolomics data, guiding beginners to create publication-ready graphics and enabling robust, reproducible chemometric analysis.
LabRulez
tag
share
more
VaMPIS - Validation of Measurement Procedures that Include Sampling
Article | Academy

VaMPIS - Validation of Measurement Procedures that Include Sampling

Eurachem/CITAC VaMPIS guidance introduces validation of measurement procedures that include sampling, using measurement uncertainty to assess fitness for purpose in both in situ and ex situ measurements.
Eurachem
tag
share
more
Understanding PT statistics
Article | Academy

Understanding PT statistics

Learn how proficiency testing providers calculate assigned values, uncertainty, and data dispersion, and how these statistics help laboratories interpret PT results correctly.
Eurachem
tag
share
more
Understanding PT performance assessment
Article | Academy

Understanding PT performance assessment

Learn how proficiency testing providers assign reference values, estimate uncertainties, calculate performance scores, and interpret z, zeta, En, and percentage difference results.
Eurachem
tag
share
more
Other projects
GCMS
ICPMS
Follow us
FacebookX (Twitter)LinkedInYouTube
More information
WebinarsAbout usContact usTerms of use
LabRulez s.r.o. All rights reserved. Content available under a CC BY-SA 4.0 Attribution-ShareAlike