Untargeted Metabolomics Identifies N-Lactoyl-Amino Acids as Dose-Responsive Plasma Biomarkers of Metformin Adherence in Type 2 Diabetes

Clin Pharmacol Ther, 2026, 119: 1057-1069: Graphical abstract
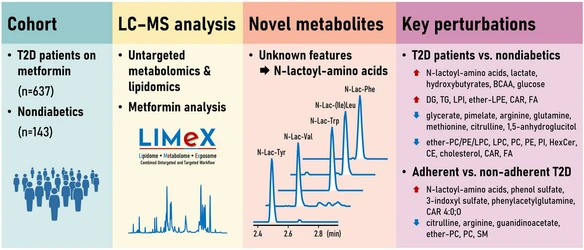
Using untargeted metabolomics and lipidomics, this study analyzed plasma samples from patients with type 2 diabetes to identify biomarkers associated with metformin use. Five previously unannotated metabolites were identified as N-lactoyl-amino acids, whose concentrations showed strong, dose-dependent correlations with plasma metformin levels and increased markedly in patients with high drug exposure.
Beyond these biomarkers, the study revealed broad metabolic and lipidomic alterations linked to diabetes and metformin treatment, including changes in lactate, amino acid, and lipid metabolism. The findings establish N-lactoyl-amino acids as promising objective biomarkers for monitoring metformin adherence and pharmacodynamic response in clinical practice.
The original article
Untargeted Metabolomics Identifies N-Lactoyl-Amino Acids as Dose-Responsive Plasma Biomarkers of Metformin Adherence in Type 2 Diabetes
Tomas Cajka, Jiri Hricko, Lucie Rudl Kulhava, Michaela Paucova, Michaela Novakova, Veronika Hola, Stanislava Rakusanova, Oliver Fiehn, Vojtech Skop, Ivana Lankova, Iva Miskova, Terezie Pelikanova, Martin Haluzik
Clin Pharmacol Ther, 2026, 119: 1057-1069
licensed under CC-BY 4.0
Selected sections from the article follow. Formats and hyperlinks were adapted from the original.
Type 2 diabetes (T2D) is a multifactorial metabolic disorder characterized by chronic hyperglycemia and insulin resistance, currently affecting over 500 million individuals worldwide.1 While the disease is classically defined by impaired glucose homeostasis, the associated metabolic dysregulation extends to amino acid, lipid, and energy metabolism. To capture this systemic disturbance, untargeted metabolomics has emerged as a powerful tool, enabling comprehensive profiling of small molecules in biofluids and tissues.2-4 Complementary lipidomics approaches further delineate changes in complex lipids, such as ceramides, sphingolipids, and glycerophospholipids that are increasingly implicated in insulin resistance, beta cell dysfunction, and T2D progression.5
Recent untargeted metabolomics studies have consistently reported elevated levels of branched-chain amino acids (BCAA), aromatic amino acids (phenylalanine, tyrosine), and specific lipid species in T2D patients relative to healthy controls.5, 6 Concurrent reductions in glycine, glutamine, and short-chain acylcarnitines are also frequently observed.7, 8 These metabolic perturbations reflect underlying disease mechanisms and hold potential as predictive or diagnostic biomarkers.
Metformin remains the first-line pharmacological treatment for T2D due to its efficacy in lowering blood glucose, affordable price, and multiple long-term positive effects demonstrated in numerous trials.9 Globally, it is estimated that more than 200 million people with T2D are prescribed metformin, highlighting its central role in diabetes management.10 Its mechanisms of action extend beyond glycemic control to include modulation of mitochondrial function, one-carbon metabolism, and the gut microbiome.11 Beyond diabetes, metformin is also being investigated for possible anti-cancer and geroprotective effects,12, 13 including recent evidence from primates,14 although these roles remain to be established.
Metformin treatment has been shown to alter circulating levels of bile acids, acylcarnitines, and microbiota-derived metabolites.15, 16 It also modulates lipid metabolism by reducing chylomicron secretion and improving cholesterol handling.17 However, non-adherence, commonly due to gastrointestinal side effects, remains a major barrier to therapeutic success.18 In large-scale observational or interventional studies, self-reported compliance is often unreliable, emphasizing the need for objective biomarkers of drug adherence.19
Among emerging metabolite classes, N-lactoyl-amino acids have gained attention as novel metabolic conjugates formed via carnosine dipeptidase 2 (CNDP2)-mediated condensation of lactate and amino acids.20 These molecules have been detected in plasma, urine, and tissues under various physiological and pathological states, including exercise,21-23 and metformin treatment.24 Although their biological functions are not fully understood, N-lactoyl-amino acids reflect metformin’s effects on glycolytic and mitochondrial activity, with N-lactoyl-phenylalanine suppressing appetite in vivo.24
Despite growing interest, N-lactoyl-amino acids remain largely uncharacterized in the context of diabetes and pharmacometabolomics. Their potential utility as biomarkers of metformin exposure or adherence is compelling, as they may integrate information on drug action and host metabolic state.25 However, their suitability for clinical monitoring has not yet been systematically evaluated.
In this study, we apply untargeted metabolomics and lipidomics to plasma samples from a well-characterized human cohort to identify metabolites associated with metformin exposure and adherence (Figure 1). By comparing treated and untreated individuals across glycemic and BMI strata, we aim to: (i) define metabolic differences between T2D and non-T2D subjects; (ii) identify metabolite signatures associated with metformin therapy; and (iii) evaluate N-lactoyl-amino acids as candidate biomarkers of drug adherence.
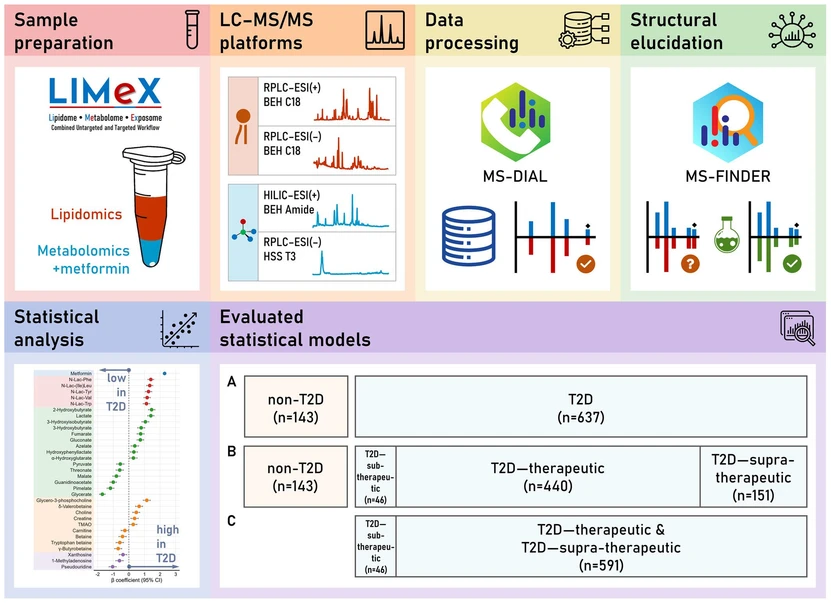 Clin Pharmacol Ther, 2026, 119: 1057-1069: Figure 1: LIMeX workflow for untargeted metabolomic and lipidomic analysis of plasma from metformin-treated T2D patients and nondiabetic controls. Samples undergo biphasic extraction to separate polar metabolites and complex lipids, which are analyzed using a multiplatform LC–MS approach. MS1 and MS/MS data are processed in MS-DIAL, with structure elucidation supported by MS-FINDER and confirmed using synthetic standards for N-lactoyl-amino acids. Statistical analyses were performed using multiple linear regression. T2D patients were stratified by plasma metformin into sub-therapeutic (≤ 100 ng/mL), therapeutic (101–2000 ng/mL), and supra-therapeutic (> 2000 ng/mL) groups.
MATERIALS AND METHODS
LC–MS analysis
Untargeted metabolomic and lipidomic profiling of plasma samples was performed using biphasic solvent extraction with methanol, methyl tert-butyl ether, and water (LIMeX workflow, Figure 1), followed by analysis on four liquid chromatography–mass spectrometry (LC–MS) platforms under previously optimized conditions.26
Raw files were processed using MS-DIAL software (v. 4.9.221218), including annotating polar metabolites and complex lipids. Metabolites were evaluated based on retention times and spectral information from MS1 and MS/MS libraries. Exported peak heights provided semi-quantitative data within the linear dynamic range of the detector. Quality control samples were injected after every 10 study samples and were used to correct for longitudinal signal drift using locally estimated scatterplot smoothing (LOESS).
Metformin quantification was incorporated within the metabolomic workflow using a calibration curve. N-Lactoyl-amino acids were synthesized using 1-ethyl-3-(3-dimethylaminopropyl)carbodiimide and 4-(dimethylamino)pyridine as coupling agents. For hydrogen/deuterium exchange (HDX)-MS, solvents were replaced with deuterated counterparts. Additional details regarding materials, reagents, sample preparation, LC–MS analysis, quality control, data processing, N-lactoyl-amino acid synthesis, and reference standardization are provided in the Supplementary Information.
LC–MS conditions
The LC–MS system comprised a Vanquish UHPLC system (Thermo Fisher Scientific) and a Q Exactive Plus mass spectrometer (Thermo Fisher Scientific) equipped with a heated electrospray ionization (HESI-II) probe (Thermo Fisher Scientific).
RESULTS
Structure elucidation of unknown metabolites in metformin-treated T2D patients
Metabolomic profiling revealed significant perturbations across multiple metabolite classes in T2D patients on metformin compared to nondiabetic controls. Among the 67 statistically significant polar metabolites (Table S3), five were initially classified as “unknowns” and distinguished by their retention times, precursor masses (MS1), and fragmentation (MS/MS) spectra. These metabolites showed particularly strong associations with T2D status (β = 1.13–1.41, P < 0.0001).
Structural elucidation revealed a characteristic neutral loss of 72.02 Da in MS/MS spectra. MS-FINDER software (Tsugawa et al.28) annotated these features as N-lactoyl-amino acids, including N-lactoyl-phenylalanine (N-Lac-Phe), N-lactoyl-(iso)leucine (N-Lac-(Ile)Leu), N-lactoyl-valine (N-Lac-Val), N-lactoyl-tryptophan (N-Lac-Trp), and N-lactoyl-tyrosine (N-Lac-Tyr). Of note, earlier reports had misidentified these compounds as carboxyethyl derivatives of the corresponding amino acids.24
Synthetic standards confirmed these identities via matching retention times, MS1, and MS/MS spectra. HDX-MS further validated the structures based on exchangeable hydrogens (Figures 2, S2, S3). N-Lac-Leu and N-Lac-Ile were chromatographically coeluted and are reported jointly as N-Lac-(Ile)Leu. All N-lactoyl-amino acids correlated with plasma metformin levels (ρ = 0.42–0.55, P < 0.0001) (Figure 3), supporting a pharmacometabolomic link.
![Clin Pharmacol Ther, 2026, 119: 1057-1069: Figure 2: LC–MS analysis of N-lactoyl-amino acids. (a) Extracted ion chromatograms of N-lactoyl-amino acids detected in a plasma sample using the metabolomics platform with reversed-phase liquid chromatography and negative electrospray ionization [RPLC–ESI(−)-MS]. Compounds were initially annotated as “unknowns” and distinguished by their retention times, MS1, and MS/MS spectra. (b) Representative MS/MS spectra of N-Lac-Phe from plasma and synthetic standard acquired under RPLC–ESI(−)-MS and RPLC–HDX-ESI(−)-MS conditions, highlighting a neutral loss of 72.02 Da (lactic acid minus H2O) and three exchangeable protons.](https://lcms.labrulez.com/labrulez-bucket-strapi-h3hsga3/Clin_Pharmacol_Ther_2026_119_1057_1069_Figure_2_LC_MS_analysis_of_N_lactoyl_amino_acids_967f515806_l.webp) Clin Pharmacol Ther, 2026, 119: 1057-1069: Figure 2: LC–MS analysis of N-lactoyl-amino acids. (a) Extracted ion chromatograms of N-lactoyl-amino acids detected in a plasma sample using the metabolomics platform with reversed-phase liquid chromatography and negative electrospray ionization [RPLC–ESI(−)-MS]. Compounds were initially annotated as “unknowns” and distinguished by their retention times, MS1, and MS/MS spectra. (b) Representative MS/MS spectra of N-Lac-Phe from plasma and synthetic standard acquired under RPLC–ESI(−)-MS and RPLC–HDX-ESI(−)-MS conditions, highlighting a neutral loss of 72.02 Da (lactic acid minus H2O) and three exchangeable protons.
Clin Pharmacol Ther, 2026, 119: 1057-1069: Figure 2: LC–MS analysis of N-lactoyl-amino acids. (a) Extracted ion chromatograms of N-lactoyl-amino acids detected in a plasma sample using the metabolomics platform with reversed-phase liquid chromatography and negative electrospray ionization [RPLC–ESI(−)-MS]. Compounds were initially annotated as “unknowns” and distinguished by their retention times, MS1, and MS/MS spectra. (b) Representative MS/MS spectra of N-Lac-Phe from plasma and synthetic standard acquired under RPLC–ESI(−)-MS and RPLC–HDX-ESI(−)-MS conditions, highlighting a neutral loss of 72.02 Da (lactic acid minus H2O) and three exchangeable protons.
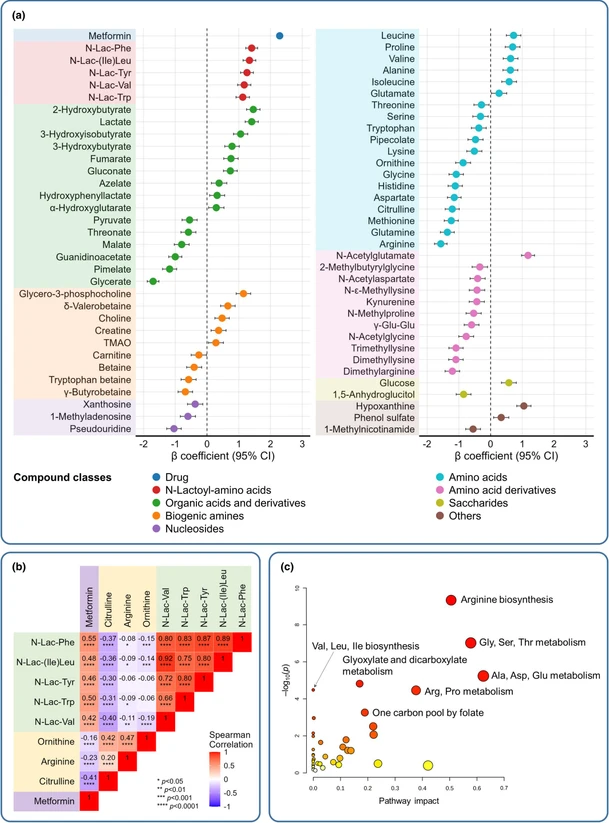 Clin Pharmacol Ther, 2026, 119: 1057-1069: Figure 3: Metabolomic profiling of metformin effects in T2D. (a) Perturbations across polar metabolite classes in T2D patients on metformin (n = 637) compared to nondiabetic controls (n = 143) with metabolites with P < 0.05 used for visualization, (b) correlations between plasma levels of metformin, N-lactoyl-amino acids, and urea cycle-related amino acids in T2D subjects (n = 637), (c) pathway analysis of metabolites significantly altered between non-T2D and T2D individuals.
DISCUSSION
Clinical implications for adherence monitoring
In pharmacokinetic terms, plasma metformin concentrations below 100 ng/mL are considered sub-therapeutic and indicate non-adherence.29 Accordingly, metabolic differences were stratified into three groups based on these levels: sub-therapeutic (≤ 100 ng/mL; non-adherent, n = 46), therapeutic (101–2000 ng/mL; adherent, n = 440), and supra-therapeutic (> 2000 ng/mL; adherent, n = 151). Clear metabolic distinctions emerged between non-adherent and adherent T2D patients. All five N-lactoyl-amino acids were significantly elevated in the adherent groups, consistent with metformin’s known enhancement of anaerobic glycolysis and lactate production. This increase in lactate provides substrate for reverse proteolysis, linking N-lactoyl-amino acid formation to metformin-driven complex-I inhibition.24
Conventional clinical measures (fasting plasma glucose, HbA1c) did not differ between non-adherent and adherent T2D groups, demonstrating the added value of untargeted metabolomics for detecting pharmacodynamic effects that remain invisible to standard glycemic indices. These results nominate N-lactoyl-amino acids as candidate pharmacodynamic markers of metformin adherence and highlight potential systemic trade-offs of treatment, including altered nitrogen handling and host–microbiome co-metabolism.
Our use of a ≤ 100 ng/mL threshold to define sub-therapeutic exposure reflects a conservative, literature-informed choice. Steady-state plasma concentrations can extend below this level (≈50–60 ng/mL),56 and our conclusions rely on dose–response trends across the full concentration range rather than a single fixed cut-off.
Although small, the inverse association between metformin concentrations and total cholesterol (β = −0.04, P = 0.04) is directionally consistent with metformin’s reported lipid-lowering effects (Christensen et al.57). At the same time, we did not observe corresponding changes in free cholesterol or cholesteryl esters in the LC–MS-based lipidomics data. This pattern differs from the nondiabetic vs. T2D comparison, where clinical total cholesterol and multiple cholesteryl ester species changed in parallel. Thus, these observations suggest that the adherence-related cholesterol effect is biologically modest rather than indicative of a meaningful lipid shift.