Tips and tricks for LC–MS-based metabolomics and lipidomics analysis
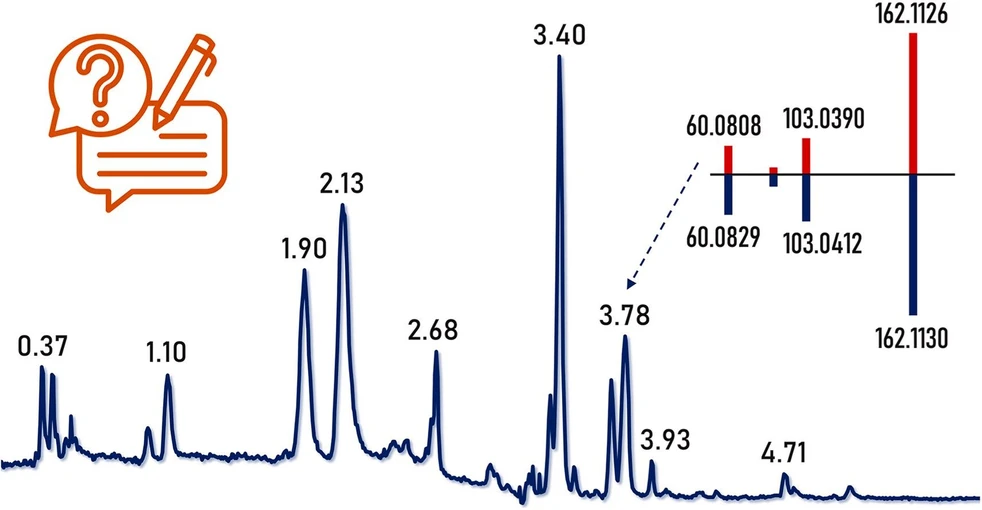
- TrAC Trends in Analytical Chemistry 2024, 180, 117940: graphical abstract
In the research article published recently in Trends in Analytical Chemistry journal the researchers from the Institute of Physiology of the Czech Academy of Sciences, Prague, Czechia, gave comprehensive overview of metabolomics and lipidomics tools.
The article provides a comprehensive guide for beginners in metabolomics and lipidomics, two rapidly growing fields that offer insights into biological processes at the molecular level. The guide covers topics such as power analysis, sample collection, preparation, and the detection of metabolites using liquid chromatography–mass spectrometry (LC-MS). It also addresses data processing, quality control, statistical analysis, and data sharing, offering practical tips and tricks. The overview was assembled to help researchers navigate the complexities of metabolomic and lipidomic profiling across various research areas.
The original article
Tips and tricks for LC–MS-based metabolomics and lipidomics analysis
Stanislava Rakusanova, Tomas Cajka
TrAC Trends in Analytical Chemistry 2024, 180, 117940
https://doi.org/10.1016/j.trac.2024.117940.
licensed under CC-BY 4.0
Selected sections from the article follow.
Highlights
- Comprehensive overview of metabolomics and lipidomics tools.
- Tips and tricks based on current metabolomics and lipidomics analysis approaches.
- Practical insights applicable to diverse research areas.
Abstract
Metabolomics and lipidomics are rapidly growing fields, leading to novel discoveries and advancing the understanding of biological processes at the molecular level. However, designing a proper workflow and choosing from countless options can be challenging, especially for beginners in the field. To address this challenge, we provide a comprehensive overview of metabolomics and lipidomics tools and a step-by-step guide that includes “tips and tricks” based on current metabolomics and lipidomics analysis approaches. We include power analysis, sample collection and preparation, separation and detection of metabolites using primarily liquid chromatography–mass spectrometry (LC–MS), processing of raw instrumental files, quality control, statistical analysis, and data sharing. This guide offers practical insights applicable to diverse research areas, covering all the essential steps in metabolomic and lipidomic profiling.
1. Introduction
Metabolomics and lipidomics study low-molecular-weight compounds (typically <2000 Da) in biological matrices such as biofluids, tissues, or cells under different conditions. While metabolomics primarily focuses on water-soluble polar metabolites, such as sugars, amino acids, organic acids, and nucleotides, lipidomics aims to identify and quantify various lipid species [1]. There is a partial overlap between these two omics fields, and in some studies, polar metabolites and complex lipids are also referred to by the general term “metabolomics.”
Understanding how biological processes work can be crucial for biomarker discovery, clinical studies, metabolic phenotyping, physiology, or toxicology. To this end, various techniques for analyzing the metabolome and lipidome are available. These techniques include mass spectrometry (MS) [2,3] and nuclear magnetic resonance (NMR) [4,5]. MS methods are performed as liquid chromatography–MS (LC–MS), gas chromatography–MS (GC–MS), capillary electrophoresis–MS (CE–MS), direct infusion–MS, and also ion mobility–MS (IM-MS). Currently, LC–MS represents the most applied tool for analyzing polar and nonpolar metabolites and offers the highest coverage of the metabolome and lipidome compared to other techniques.
Metabolome and lipidome can be studied using untargeted and targeted methods. Untargeted methods analyze all the detectable metabolites in a sample and are mainly used for novel metabolite discovery and hypothesis-generating studies [6]. Conversely, targeted methods focus on analyzing defined metabolites for hypothesis-driven validation [6,7]. While untargeted methods provide semiquantitative data (i.e., results are reported as peak areas or heights in arbitrary units), the targeted methods provide quantitative data reported in molar concentrations. In addition, untargeted and targeted methods can be combined, providing quantitative data for selected metabolites while reporting the other metabolites (including unknowns) in semiquantitative terms [8].
Since metabolomics and lipidomics are no longer emerging but rather well-established fields, dozens of untargeted and targeted analytical protocols based on MS or NMR, along with bioinformatics tools, are available. However, the availability of so many tools can be overwhelming for both beginners and experienced professionals in the field. Like other omics fields, metabolomics and lipidomics analyses are prone to biases. Thus, a community effort such as the recently established metabolomics Quality Assurance and Quality Control Consortium (mQACC, mqacc.org) may help standardize metabolomics and lipidomics analyses [9]. In this context, we present a comprehensive overview of metabolomics and lipidomics tools (Fig. 1), accompanied by a step-by-step guide that includes “tips and tricks” to avoid possible pitfalls and optimize workflows for generating reliable data for interpretation.
 TrAC 2024, 180, 117940: Fig. 1. Metabolomics and lipidomics workflow.
2. Power analysis and sample size
Determining the sample size (both total and per group) is crucial in study design. Insufficient sample size can result in multiple errors. Interestingly, even small differences with no actual significance might become statistically significant in a larger sample size. On the other hand, with a small number of samples, clinically important effects may appear statistically non-significant [10]. A small sample size can also cause a lack of precision. In contrast, a high sample size might lead to unnecessary waste of resources for minimal information gain. Additionally, ethical restrictions must be considered when determining an appropriate number of samples per group, especially concerning animals [11].
Calculating the minimal sample size is based on power analysis. Power analysis helps to determine the smallest number of samples per group, given a required significance level (usually α = 0.05, and 0.1–0.2 for a pilot study), statistical power (usually 0.8), and effect size (d = 0.8, 0.5, 0.2 for large, medium, small effect size, respectively) [12]. Power analysis can be done before and after data analysis. However, sufficient sample size is required to obtain statistically validated data. Therefore, it is necessary to perform the power analysis before the beginning of the experiment [13]. For instance, G*Power software can provide effect size calculators and graphic options [14].
However, power analysis in untargeted metabolomics and lipidomics studies is challenging because the list of measured metabolites and the effect size are not known a priori [15]. Choosing a known metabolite to represent the entire metabolome/lipidome and conducting a univariate method to estimate the sample size can be used, although such statistics might oversimplify the metabolome/lipidome changes. It is often recommended that a pilot study is performed to obtain preliminary data before designing more extensive studies [16].
For metabolomics data, Billoir et al. [17] released an automated implementation of the Data-driven Sample size Determination (DSD) algorithm for MATLAB and GNU Octave, which enables the determination of optimized sample size in metabolic phenotyping studies. Their approach also uses analytical data from a small pilot cohort. On the contrary, Nyamundanda et al. [18] developed MetSizeR to estimate sample size for metabolomics experiments even when experimental pilot data are unavailable. In 2020, Li et al. [19] introduced the online tool SSizer (idrblab.org/ssizer), enabling the assessment of sample sufficiency and determining the required number of samples for a user-input biological dataset.
2.1. Tips and tricks
Since conducting power analysis for untargeted methods might be difficult, a general recommendation is used regarding the minimum samples per group to be analyzed. For cells under tightly controlled conditions, a minimum of 5 replicates is recommended [20], although some studies have used even fewer (3–4 replicates). In animal studies, factors such as age, housing, and diet are typically controlled; therefore, sample numbers can also be kept relatively low for ethical and practical reasons [20]. A minimum of 5–10 samples is recommended for biofluids and tissues per group (usually more for tissues due to their high heterogeneity) [21]. In human studies, at least 20–30 samples per class are advised [12,22]. However, the number of samples can range easily from hundreds [23] to even thousands [24] for reasonable statistics, leading to novel biomarker discoveries during clinical studies. Conversely, clinical studies may encounter limited subjects due to budget and recruiting constraints [15].
The variation of animal and human metabolomes might be influenced (among others) by genetics, age, and sex. However, sex is still not always considered in metabolomics-based investigations, potentially limiting the comprehensive understanding of metabolic profiles and their implications. Therefore, in both animal and human studies, it is recommended to maintain a balanced ratio of male and female subjects to ensure a more accurate and representative exploration of metabolic dynamics [25].
3. Sample collection
Sample collection methods differ depending on the sample type and analysis. The choice of biological material and the amount required for further processing steps are based on the experimental design and tested hypothesis. Incorrect sample collection or storage can lead to degradation of metabolites, high variability, or interferences with instrumentation [26]. In animal studies, specially trained personnel are recommended to use the time between collection and organ dissection as efficiently as possible. Proper training and experience are crucial while collecting multiple biofluids and tissues from all animals [27].
Quenching the metabolism of samples needs to be done as soon as possible, followed by storage of these samples at ─80 °C. Quenching should terminate all enzyme and chemical activities and avoid the perturbation of existing metabolite levels during harvesting [28]. This process should be done by liquid nitrogen, dry ice, or freeze-clamping. Before tissue collection, it is essential to determine which part of each organ will be sampled. Furthermore, for studies including plasma, the type of coagulant (e.g., ethylenediaminetetraacetic acid, citrate, heparin) must be specified in advance [29].
3.1. Tips and tricks
Various sizes of plastic tubes are available to deliver biological samples for extraction. Remember that tissues undergo homogenization supported by grinding balls made of stainless steel, tungsten carbide, or zirconium oxide; thus, the use of 2 mL conical bottom tubes is needed for effective homogenization (i.e., 1.5 mL “V” bottom tubes are not helpful and grinding balls may be stuck during homogenization).
There is an ongoing discussion about whether serum or plasma is the best for metabolomics and lipidomics experiments [30,31]. Remember that serum is prepared from whole blood, allowing the blood to clot by leaving it undisturbed at room temperature (usually 15–60 min, but this step is not always possible to keep under control and can vary based on the personnel's experience and training). On the other hand, plasma is prepared by collecting the whole blood into commercially available anticoagulant-treated tubes (in human studies). For animal studies (e.g., mouse, rat) collecting low volumes (<100 μL) of blood, the quantity of anticoagulant could be too high in tubes for human studies; thus, low-volume commercially anticoagulant-treated tubes or in-house tubes with an appropriate amount of anticoagulant are advised.
Some metabolites are more prone to degradation or rearrangement, and some are less. Based on the considered analytical platform, remember that some metabolites are extremely unstable and require proper handling and usually a separate (targeted) sample preparation and instrumental platform; for instance, analysis of eicosanoids, endocannabinoids [32], dinucleotide redox cofactors (NADPH/NADP+, NADH/NAD+) [33], adenine nucleotides (AMP, ADP, and ATP), acyl-coenzymes A [34]. In addition, dry extracts are also prone to thermal reactions and should be stored at low temperatures (─80 °C or ─24 °C) [35].
4. Sample extraction
Effective metabolite extraction is key to successful metabolomics and lipidomics studies. It helps to separate metabolites from undesired compounds and makes samples suitable for instrumental analysis [36]. Biological fluids such as urine can be analyzed directly without sample extraction. Often used steps in urine sample preparation include buffering, dilution, evaporation, or centrifugation. However, these steps may lead to metabolite losses, high salt concentration can lead to ionization suppression and altered adduct formation, and disrupt instrumental performance by forming nonvolatile residues. These complications can be reduced by adding an effective extraction step.
On the other hand, biofluids such as plasma or serum, which contain a wide range of interfering proteins, are not commonly analyzed directly, and an extraction step is added for protein removal [37]. Organic-solvent-based protein precipitation or liquid–liquid extraction (LLE) methods are often used during the extraction. These methods enable the extraction of a wide range of metabolites and simultaneously remove unwanted substances in biological samples, such as bulk proteins and salts [38]. However, in recent years, the all-in-one single extraction methods have been developed to isolate metabolites differing in their physicochemical properties, followed by fractionation. Each fraction is then analyzed under different separation conditions based on the polarity [39].
Single-phase extraction methods have been introduced using an isopropanol or butanol/methanol mixture to simultaneously extract complex lipids and polar metabolites from human plasma [40]. These methods were evaluated based on the metabolome and lipidome coverage, extraction efficiencies, effectiveness of protein precipitation, and reproducibility, and they were suitable for large-scale human population studies. Shortcomings of such methods might be found in ion suppression caused by co-eluting complex lipids in the chromatographic conditions during the analysis of polar metabolites.
Two-phase liquid extraction is commonly used in metabolomics and lipidomics, where one phase consists primarily of nonpolar metabolites (lipids), and the second phase holds mostly polar metabolites. This can be achieved using three solvent systems: methyl tert-butyl ether (MTBE)/methanol/water [41], chloroform/methanol/water [42], and dichloromethane/methanol/water [43].
Three-phase liquid extraction is possible using hexane, methyl acetate, acetonitrile, and water. The upper organic phase consists of neutral lipids such as triacylglycerols and cholesteryl esters, the middle organic phase is enriched in glycerophospholipids, and the bottom aqueous phase consists of polar metabolites and proteins [44]. Therefore, proteins need to be removed to analyze polar metabolites.
Along with the already mentioned LLE methods, solid-phase extraction (SPE) and solid-phase microextraction (SPME) methods are available for analyzing biological samples [45].
Besides biofluids, various tissues and cells are analyzed in metabolomics and lipidomics studies. While biofluids are convenient during their analysis, tissues and cells provide deeper insights into metabolomics, making them the focus of clinical research over the years [29].
4.1. Tips and tricks
Different volumes of biofluids (e.g., plasma, serum, urine) and tissue amounts are needed for their analysis [46]. For untargeted methods, 10–30 μL of biofluids and 5–20 mg of tissues are sufficient. For targeted methods usually covering trace concentrations of some metabolites (e.g., eicosanoids, fatty acyl esters of hydroxy fatty acid), 200–1000 μL of biofluids and 50–200 mg of tissue samples are needed. Remember that it is always good to provide (or keep) backup samples if reanalysis is needed. For cells, usually at least 5 × 10⁵ is needed. For adherent cells, a 6-well plate format is preferred. After completing the cell growth, the medium is removed, followed by washing with buffer (e.g., phosphate-buffered saline) to remove residues of the medium. After removing the washing buffer, the cells are either immediately extracted (with a cold organic solvent or mixture and scraping them) or frozen in liquid nitrogen and stored at ─80 °C before conducting the extraction. For suspension cells, centrifugation at low speed (<1000×g) is used first, followed by aspiration and discarding of the culture medium.
Manual or electronic pipettes have inaccuracy, which depends on the range of a particular pipet and the pipetted volume [47]. For instance, for a 10–100 μL range pipet, the inaccuracy while pipetting 10 μL is usually ±0.3 μL (i.e., 3 %), while for 100 μL ±0.8 μL (i.e., 0.8 %) based on the vendor. However, for a 1–10 μL range pipet while pipetting 10 μL, the inaccuracy is lower ±0.1 μL (i.e., 1 %); thus, the pipetting volume should be considered when choosing the appropriate pipette for a specific task, taking into account the inaccuracy associated with the pipetted volume and the designated range. Although these errors fall within acceptable limits, regular maintenance, preferably annually, is advisable to ensure pipetting equipment's continued precision and reliability. For weighing the tissue samples, analytical balance (readability 0.1 mg) should be used instead of precision balance (readability 1 mg) since low amounts of tissues (5–20 mg) are often used. A dedicated person should also regularly calibrate the balance to ensure accuracy.
Biofluid extraction can be performed using either glassware or plastic consumables. Glassware such as tubes, syringes, and pipettes is typically recommended to prevent background signals or the sorption of metabolites. However, when conducting large sample studies, using glassware consumables becomes impractical. In such cases, it is beneficial to evaluate background signals for various types of plastic tubes, typically made of polypropylene, and monitor potential leaking contaminants such as palmitate, stearate, phthalates, and butylated hydroxytoluene. It has been shown that using plastic consumables introduces a competing background signal of palmitate during fluxomics analysis [48]. On the contrary, a study comparing extraction in plastic tubes and glass vials using radioactive lipids found comparable recoveries [49].
The choice of the extraction method also depends on the expected metabolite coverage. For instance, single-phase extraction can be sufficient for proper coverage of polar metabolites (e.g., extraction using methanol, acetonitrile, a mixture of isopropanol/acetonitrile/water, acetonitrile/methanol [50,51]) or complex lipids (e.g., extraction using isopropanol [52]). However, differences in the number of detected metabolites and method reproducibility should be anticipated [43]. On the other hand, for the simultaneous extraction of polar metabolites and complex lipids, bi-phase extraction using MTBE/methanol/water will ensure proper metabolome and lipidome coverage [53]. In addition, remember that each sample preparation may have a different efficiency in protein removal [54], which impacts the method's robustness, specifically the instrumental part (e.g., column clogging, retention time shifts, worsening separation of isomers).
When employing two-phase liquid extraction methods, remember that in MTBE (ρ 0.74 g/cm3)/methanol (ρ 0.79 g/cm3)/water (ρ 1.00 g/cm3) protocol [41], the upper phase comprises the organic layer (MTBE and methanol), primarily containing complex lipids. In contrast, the lower phase consists of water (with a small portion of methanol), containing polar metabolites. Conversely, in chloroform (ρ 1.49 g/cm3)/methanol/water [42] and dichloromethane (ρ 1.33 g/cm3)/methanol/water protocols [43], the upper (polar) phase contains polar metabolites, and the bottom (organic) phase is enriched with complex lipids.
While validation parameters such as selectivity, specificity, matrix effect, range, accuracy, precision, carry-over, dilution integrity, and stability are commonly employed for targeted methods, there are no established guidelines for validating the analytical aspect in an untargeted approach [55]. Instead, emphasis is placed on developing the extraction method with minimal steps, ensuring compatibility with the instrumental technique, and achieving comprehensive coverage of metabolites with high precision. These methods can be assessed by evaluating precision (intra-assay and inter-assay) to calculate the relative standard deviation (RSD) of molecular features (retention time–m/z pairs) or already annotated metabolites. Acceptable values are typically close to a 30 % RSD [56]. Furthermore, linearity can be confirmed by diluting the sample used during validation and employing more concentrated extracts to mimic potential ion suppression effects. Method blanks should also be incorporated to identify and address carryover during method development. Any features detected in blanks should be considered background signals [55].
Using internal standards in the extraction and resuspension solvents ensures proper quality control (QC), such as that identical aliquots were collected from all extracts or that the autosampler injected the correct volume. Reanalysis is needed for samples where internal standards are completely missing or at low intensity compared to the rest of the study.
5. Instrumental analysis
LC–MS is the most popular platform for metabolomics and lipidomics, followed by GC–MS. GC–MS is used mainly to analyze volatile and primary metabolites after derivatization. CE–MS helps analyze polar charged metabolites. Recently, there has also been increased interest in IM-MS. In addition, analysis of polar and nonpolar metabolites can be done with NMR. However, the NMR method does not provide many annotated metabolites compared to MS [27].
Metabolomics and lipidomics detect many metabolites with high chemical diversity and complexity. LC–MS allows for separating and detecting isobars and isomers, reducing ion-suppression effects, and separating compounds according to their physicochemical properties [35]. No single method can cover the true breadth of a metabolome/lipidome. However, LC offers various stationary phases, column dimensions, mobile phase modifiers, and solvents [57]. Thus, different LC–MS separation modes enable the coverage of a wide range of metabolites.
Reversed-phase LC (RPLC) separates polar to mid-polar metabolites, and hydrophilic interaction chromatography (HILIC) separates highly polar metabolites. In addition to RPLC and HILIC, lipidomics also uses normal-phase LC (NPLC) and supercritical fluid chromatography (SFC) for sample separation [58,59]. In RPLC, C18 columns dominate, followed by C8 and C30. HILIC, on the other hand, employs more diverse stationary phase chemistries such as silica, aminopropylsilane, alkyl amide, and sulfobetaine groups [57]. Mobile phases containing water, acetonitrile, or methanol are used to analyze polar metabolites. In contrast, for RPLC-based lipidomics, stronger mobile phases with a high percentage of isopropanol are needed. The separation time usually ranges from 10 to 30 min. Fig. 2 shows the separation of very polar metabolites, demonstrating the benefits of HILIC configuration (high retention and separation of metabolites, Fig. 2A) compared to RPLC (elution of metabolites near the void volume, Fig. 2B).
![TrAC 2024, 180, 117940: Fig. 2. Examples of separating polar metabolites in human serum extracts using fast HILIC–ESI(+)-MS and RPLC–ESI(+)-MS methods (4.4 min injection-to-injection time): trimethylamine N-oxide (TMAO) (XlogP ─0.93), glucose (XlogP ─2.9), asparagine (XlogP ─4.3), trimethyllysine (XlogP ─6.2), lysine (XlogP ─3.2). (a) The ACQUITY Premier BEH Amide column (50 mm × 2.1 mm i.d.; 1.7 μm particle size) equipped with a VanGuard FIT cartridge (5 mm × 2.1 mm i.d.; 1.7 μm particle size) (Waters, Milford, MA, USA) was utilized to separate polar metabolites based on the HILIC mechanism. (B) The ACQUITY Premier HSS T3 column (50 mm × 2.1 mm i.d.; 1.8 μm particle size) equipped with a VanGuard FIT cartridge (5 mm × 2.1 mm i.d.; 1.8 μm particle size) (Waters) was utilized to separate polar metabolites based on the RPLC mechanism. Details of separation conditions are provided in Ref. [ 35 ]. XlogP data for representative metabolites were taken from the HMDB (hmdb.ca).](https://lcms.labrulez.com/labrulez-bucket-strapi-h3hsga3/Trends_in_Analytical_Chemistry_Tr_AC_2024_180_117940_Fig_2_Examples_of_separating_polar_metabolites_in_human_serum_extracts_using_fast_HILIC_ESI_MS_and_RPLC_ESI_MS_methods_8b1285f902_l.webp) TrAC 2024, 180, 117940: Fig. 2. Examples of separating polar metabolites in human serum extracts using fast HILIC–ESI(+)-MS and RPLC–ESI(+)-MS methods (4.4 min injection-to-injection time): trimethylamine N-oxide (TMAO) (XlogP ─0.93), glucose (XlogP ─2.9), asparagine (XlogP ─4.3), trimethyllysine (XlogP ─6.2), lysine (XlogP ─3.2). (a) The ACQUITY Premier BEH Amide column (50 mm × 2.1 mm i.d.; 1.7 μm particle size) equipped with a VanGuard FIT cartridge (5 mm × 2.1 mm i.d.; 1.7 μm particle size) (Waters, Milford, MA, USA) was utilized to separate polar metabolites based on the HILIC mechanism. (B) The ACQUITY Premier HSS T3 column (50 mm × 2.1 mm i.d.; 1.8 μm particle size) equipped with a VanGuard FIT cartridge (5 mm × 2.1 mm i.d.; 1.8 μm particle size) (Waters) was utilized to separate polar metabolites based on the RPLC mechanism. Details of separation conditions are provided in Ref. [ 35 ]. XlogP data for representative metabolites were taken from the HMDB (hmdb.ca).
TrAC 2024, 180, 117940: Fig. 2. Examples of separating polar metabolites in human serum extracts using fast HILIC–ESI(+)-MS and RPLC–ESI(+)-MS methods (4.4 min injection-to-injection time): trimethylamine N-oxide (TMAO) (XlogP ─0.93), glucose (XlogP ─2.9), asparagine (XlogP ─4.3), trimethyllysine (XlogP ─6.2), lysine (XlogP ─3.2). (a) The ACQUITY Premier BEH Amide column (50 mm × 2.1 mm i.d.; 1.7 μm particle size) equipped with a VanGuard FIT cartridge (5 mm × 2.1 mm i.d.; 1.7 μm particle size) (Waters, Milford, MA, USA) was utilized to separate polar metabolites based on the HILIC mechanism. (B) The ACQUITY Premier HSS T3 column (50 mm × 2.1 mm i.d.; 1.8 μm particle size) equipped with a VanGuard FIT cartridge (5 mm × 2.1 mm i.d.; 1.8 μm particle size) (Waters) was utilized to separate polar metabolites based on the RPLC mechanism. Details of separation conditions are provided in Ref. [ 35 ]. XlogP data for representative metabolites were taken from the HMDB (hmdb.ca).
Ultrahigh-performance LC (UHPLC) systems with sub-2 μm particles significantly increased LC performance, such as improved speed, resolution, and sensitivity. Currently, LC–MS-based metabolomics and lipidomics studies apply short (50–150 mm) microbore columns (2.1 mm internal diameter, i.d.) with sub-2 μm particles [7]. The following studies have described different applications [60,61]. Gray et al. [60] employed a 1 mm i.d. LC column rather than a <2.1 mm i.d. column, resulting in equivalent or superior performance in peak capacity, sensitivity, and robustness compared to conventional methodology. This miniaturized method required system optimization, such as reducing dispersion and ensuring appropriate connections to minimize band-broadening. This setup reduced solvent and sample consumption. Conversely, Schönberg et al. [61] employed a propylamine column (50 × 2 mm i.d., 3 μm propylamine particles) for the analysis of polar metabolites and a microLC column (100 × 0.3 mm i.d., 1.8 μm C18 particles) for the analysis of signaling lipids and retinoids. A sample was loaded with a short trap column (10 × 1 mm i.d., 1.8 μm C18 particles). This low-input metabolomics and lipidomics was applied to hematopoietic stem cells.
High-throughput LC–MS methods (<10 min) enable analyzing over a hundred samples daily. That can be achieved by modifying conventional UHPLC–MS methods, including using shorter columns, increasing column flow rate and temperature, and adjusting the LC gradient, ion source and MS settings (Fig. S1). High-throughput methods are popular in large-scale metabolomics and lipidomics. However, a lower annotation rate and chromatographic resolution compared to conventional methods should be anticipated [27].
After separating compounds, they undergo ionization in an ion source, forming charged species. Electrospray ionization (ESI) is the most frequently used method in LC–MS. It permits the ionization of small molecules (<2000 Da) as well as large molecules (peptides and proteins). ESI is considered a soft ionization technique, minimizing the fragmentation of the molecular ions. However, some metabolites can still be too fragile during ESI, resulting in various in-source fragments [62]. These fragments may also contribute to false metabolite annotations. Recent findings demonstrated that in-source fragments accounted for over 70 % of the observed peaks, suggesting that the spectra are largely influenced by fragment ions generated during ionization [63].
The presence of salts also impacts ESI performance; thus, the LC methods are limited to the use of only volatile mobile phase modifiers, with the most frequently used formic acid, acetic acid, ammonium hydroxide, ammonium formate, ammonium acetate, and ammonium bicarbonate [3]. In addition, ion suppression can occur because various analytes or other components of the analyzed matrix compete for ionization [64].
ESI can be operated in positive or negative ion mode, forming gas-phase cations or anions. Different ion forms can be formed based on the mobile phase modifiers, with protonated [M+H]+ or deprotonated [M−H]− molecules the most commonly observed species. However, when ammonium salts (e.g., ammonium formate, ammonium acetate) are used as mobile phase modifiers, some metabolites tend to form [M+NH4]+ adducts (e.g., diacylglycerols, triacylglycerols, cholesteryl esters) in positive mode, or [M+HCOO]−/[M+CH3COO]− adducts in negative mode (e.g., phosphatidylcholines, ceramides, sphingomyelins) [59]. Furthermore, adducts such as [M+Na]+, [M+K]+, or [M+Cl]− are commonly observed due to leaking metals from glass bottles (mobile phase reservoirs) or their presence in analyzed extracts.
Different MS techniques are used for compound detection in targeted and untargeted metabolomics and lipidomics. These MS techniques can be divided into low-resolution MS and high-resolution MS instruments [7]. Low-resolution (tandem mass spectrometry) triple-quadrupole (QqQ) and quadrupole/linear ion trap (QLIT) are vastly used in targeted metabolomics and lipidomics. QqQ and QLIT generally operate in a multiple reaction monitoring (MRM) mode. In principle, the precursor ion is isolated, followed by its fragmentation and subsequent detection of the generated fragment(s) (e.g., for TMAO, precursor ion m/z 76.2 → collision energy (fragmentation) → product ion m/z 58.2). These low-resolution mass analyzers enable metabolite identification and quantification, lowering the chance of false annotation; however, they can be used only for a defined number of metabolites and do not allow retrospective data analysis [65]. Contrarily, high-resolution mass analyzers used in untargeted approaches routinely operate in full mass spectra acquisition mode, which enables retrospective data mining [66].
High-resolution single-stage mass analyzers as time-of-flight (TOF) and orbital ion trap (Orbitrap) and hybrid analyzers as quadrupole/time-of-flight (QTOF) and quadrupole/orbital ion trap (Q/Orbitrap) are the main instruments used in the untargeted approach. High-resolution MS (HRMS) provides accurate mass data and improves the quality of the annotation of metabolites. The current mass resolving power for HRMS is usually 10,000–500,000 full width at half maximum (FWHM), which is much higher than the resolving power for low-resolution MS (∼1000 FWHM) [67]. Additionally, LC–HRMS reduces the analysis time during metabolomics and lipidomics studies compared to LC–QqQ/QLIT analyzers [68]. It has been shown that a resolving power above 60,000 FWHM does not increase the number of molecular features [69]. However, higher resolving power can be beneficial during fluxomics analysis, where isotopologues must be resolved from other ions, including background ions. This capability minimizes the risk of spectral coelutions [70].
High-resolution tandem mass spectrometry (HR-MS/MS) is commonly used in metabolomics and lipidomics to increase confidence during metabolite annotation. HR-MS/MS experiments are performed in data-dependent acquisition (DDA) or data-independent acquisition (DIA) modes. In DDA mode, precursor ions are selected above a preset intensity threshold and using a narrow isolation window (0.4–4 m/z units) for further fragmentation; thus, product ions are then easily related to precursor ions. However, low-abundant precursor ions are often absent from MS/MS measurement [71]. DDA provides selective MS/MS spectra due to a narrow isolation window; however, DDA settings are more complicated than DIA settings, leading to a higher risk of errors in method development and application [65].
Conversely, the DIA approach works with a wider precursor ion isolation window, allowing fragmentation of all precursor ions within the pre-set window. However, with such complex MS/MS spectra, it is hard to determine the relationship between multiple precursor ions and their fragments. Thus, DIA offers more comprehensive coverage for low-abundance precursor ions; however, the spectra quality is usually lower. Often used DIA methods include all-ion fragmentation modes (e.g., MSE, Wide-band Fragmentation, All Ion Fragmentation, MS/MSALL), which fragments all the precursor ions in wider windows (e.g., 1000 m/z or more), and sequential window acquisition of all theoretical mass spectra (SWATH-MS/MS), which usually uses 20–50 m/z unit window [72]. With a wider isolation window, the risk of contamination increases. Several programs have been developed to deconvolute the raw MS/MS spectra (e.g., MS-DIAL, DecoMetDIA, DecoID) [27].
5.1. Tips and tricks
A multiplatform LC–MS-based approach is commonly used during metabolomics and lipidomics analysis [73]. Remember that platforms might overlap, but some can provide unique detection capabilities for particular metabolites. For instance, LC–MS-based lipidomics in positive mode provide unique coverage for lipid subclasses such as diacylglycerols (DG), triacylglycerols (TG), cholesteryl esters (CE), and free cholesterol. In contrast, the negative mode detects free fatty acids (FA), fatty acid esters of hydroxy fatty acids (FAHFA), and cholesterol sulfate. Phospholipids such as (lyso-)phosphatidylcholines (LPC/PC), (lyso-)phosphatidylethanolamines (LPE/PE), (lyso-)phosphatidylinositols (LPI/PI), (lyso-)phosphatidylserines (LPS/PS), and (lyso-)phosphatidylglycerols (LPG/PG) can be detected in both platforms, but usually, one platform provides more annotations than the other (e.g., better coverage of LPC/PC in positive mode vs. LPE/PE in negative mode) [74].
When using bi-phase extraction, two LC−MS platforms are typically required for acylcarnitines since they are partitioned into the polar phase (carbon chain lengths from 2 to 10) and the organic phase (carbon chain lengths above 12) [75]. HILIC is preferred for shorter (polar) acylcarnitines, while RPLC separation is optimal for longer (less polar) acylcarnitines.
Polar metabolites are separated using RPLC or HILIC. However, HILIC is more efficient for very polar metabolites, while RPLC is for less polar metabolites. For instance, carnitine (XlogP = −4.9) can be detected using both RPLC and HILIC. However, in RPLC, the elution is close to a void volume where ion suppression can be expected (elution of other very polar metabolites, salts), while HILIC provides better retention and separation selectivity [76]. As a rule of thumb, an XlogP >0 indicates a more hydrophobic analyte suitable for RPLC, while an XlogP <0 suggests a more hydrophilic analyte for HILIC.
RPLC–MS and HILIC–MS methods require different resuspension (or reconstitution) solvent compositions to be compatible with the initial conditions of the LC gradient. In RPLC–MS-based metabolomics, favoring a high percentage of water at the beginning of the gradient, the resuspension solvent should also contain a high percentage of water as well to avoid peak deterioration of early eluting metabolites, especially when high injection volumes are used (e.g., 5 μL) [77]. For HILIC–MS, typically featuring a high percentage of acetonitrile at the beginning of the gradient, a compromise is necessary due to the solubility of polar metabolites. This requires a high percentage of water in the resuspension solvent (i.e., 70–80 % acetonitrile) compared to initial conditions (e.g., 90–95 % acetonitrile) [78]. This compromise may negatively impact the peak shape of early eluting metabolites during the injection of high volumes.Vial caps can release polydimethylsiloxanes, especially during repeated injections from the same vial (Fig. 3A and B). In RPLC–MS-based lipidomic profiling, when using isopropanol as a strong mobile phase component, they elute as homologous series separated by a 74.0189 m/z unit, potentially impacting the intensity of endogenous lipid species [79]. When multiple injections from a single vial are considered in the RPLC–MS method due to limited extract volume, vial caps from different vendors should be evaluated to minimize such contaminations. On the other hand, when using RPLC–MS and HILIC–MS with less strong mobile phases, polydimethylsiloxanes are usually not eluted; however, they tend to accumulate on the column. Thus, occasional rinsing of the column with isopropanol is helpful to remove this contamination.
![TrAC 2024, 180, 117940: Fig. 3. RPLC–ESI(+)-MS lipidomic profiling of human serum extracts (a) with and (b) without elution of polydimethylsiloxanes released from a vial cap (indicated by red circles Image 1). Polydimethylsiloxanes are eluted either as separate peaks or coeluting with the lipids. (c, d) Examples of RPLC–ESI(+)-MS analysis with a mobile phase containing LC–MS-grade isopropanol from two vendors show the total ion chromatograms (m/z 70–1050) and MS1 spectra of mobile phase impurities. The ACQUITY Premier BEH C18 column (50 mm × 2.1 mm i.d.; 1.7 μm particle size) equipped with a VanGuard FIT cartridge (5 mm × 2.1 mm i.d.; 1.7 μm particle size) (Waters) was used for lipid separation with the mobile phase including (A) 60:40 acetonitrile/water with 10 mM ammonium formate and 0.1 % formic acid, and (B) 90:10:0.1 isopropanol/acetonitrile/water with 10 mM ammonium formate and 0.1 % formic acid. To improve the solubility of ammonium salts, they should first be dissolved in a small aliquot of water before being added to the 90:10 isopropanol/acetonitrile mixture. Fig. 3 C and D reproduced (modified) with permission from Ref. [ 81 ]. Further details of separation conditions are provided in Refs. [ 73 , 81 ]. (For interpretation of the references to color in this figure legend, the reader is referred to the Web version of this article.)](https://lcms.labrulez.com/labrulez-bucket-strapi-h3hsga3/Trends_in_Analytical_Chemistry_Tr_AC_2024_180_117940_Fig_3_RPLC_ESI_MS_lipidomic_profiling_of_human_serum_extracts_a_with_and_b_without_elution_of_polydimethylsiloxanes_released_2ae380c3b0_l.webp) TrAC 2024, 180, 117940: Fig. 3. RPLC–ESI(+)-MS lipidomic profiling of human serum extracts (a) with and (b) without elution of polydimethylsiloxanes released from a vial cap (indicated by red circles Image 1). Polydimethylsiloxanes are eluted either as separate peaks or coeluting with the lipids. (c, d) Examples of RPLC–ESI(+)-MS analysis with a mobile phase containing LC–MS-grade isopropanol from two vendors show the total ion chromatograms (m/z 70–1050) and MS1 spectra of mobile phase impurities. The ACQUITY Premier BEH C18 column (50 mm × 2.1 mm i.d.; 1.7 μm particle size) equipped with a VanGuard FIT cartridge (5 mm × 2.1 mm i.d.; 1.7 μm particle size) (Waters) was used for lipid separation with the mobile phase including (A) 60:40 acetonitrile/water with 10 mM ammonium formate and 0.1 % formic acid, and (B) 90:10:0.1 isopropanol/acetonitrile/water with 10 mM ammonium formate and 0.1 % formic acid. To improve the solubility of ammonium salts, they should first be dissolved in a small aliquot of water before being added to the 90:10 isopropanol/acetonitrile mixture. Fig. 3 C and D reproduced (modified) with permission from Ref. [ 81 ]. Further details of separation conditions are provided in Refs. [ 73 , 81 ]. (For interpretation of the references to color in this figure legend, the reader is referred to the Web version of this article.)
TrAC 2024, 180, 117940: Fig. 3. RPLC–ESI(+)-MS lipidomic profiling of human serum extracts (a) with and (b) without elution of polydimethylsiloxanes released from a vial cap (indicated by red circles Image 1). Polydimethylsiloxanes are eluted either as separate peaks or coeluting with the lipids. (c, d) Examples of RPLC–ESI(+)-MS analysis with a mobile phase containing LC–MS-grade isopropanol from two vendors show the total ion chromatograms (m/z 70–1050) and MS1 spectra of mobile phase impurities. The ACQUITY Premier BEH C18 column (50 mm × 2.1 mm i.d.; 1.7 μm particle size) equipped with a VanGuard FIT cartridge (5 mm × 2.1 mm i.d.; 1.7 μm particle size) (Waters) was used for lipid separation with the mobile phase including (A) 60:40 acetonitrile/water with 10 mM ammonium formate and 0.1 % formic acid, and (B) 90:10:0.1 isopropanol/acetonitrile/water with 10 mM ammonium formate and 0.1 % formic acid. To improve the solubility of ammonium salts, they should first be dissolved in a small aliquot of water before being added to the 90:10 isopropanol/acetonitrile mixture. Fig. 3 C and D reproduced (modified) with permission from Ref. [ 81 ]. Further details of separation conditions are provided in Refs. [ 73 , 81 ]. (For interpretation of the references to color in this figure legend, the reader is referred to the Web version of this article.)
As a common rule, LC–MS-grade solvents and mobile-phase modifiers should be used during LC–MS analysis. These chemicals meet criteria such as a low mass noise level, minimal organic contamination, and minimal metal content [80]. However, the choice of such chemicals can be overwhelming because they are all labeled as “LC–MS-grade,” yet vendors may use different technologies to deliver the final products, resulting in variations in quality. Thus, it is recommended that solvent quality in LC–MS analysis be evaluated, especially when developing new methods. The choice of organic solvents can significantly impact the LC–MS system's overall performance, affecting the ionization and detection of analytes [81]. Notably, a study evaluating isopropanol, a commonly used solvent, during RPLC–MS lipidomic profiling found that the most abundant mobile-phase impurities included the homologous series of amines, dioctyl phthalate, erucamide, Irgafos 168 oxide and its oxidized form, and Irganox 1076 [81]. Fig. 3C and D compare the use of isopropanol from two vendors, indicating significant differences in background contamination originating from mobile phases. Other common interferences and contaminants encountered during LC–MS are summarized in a review by Keller et al. [82].
Mobile phase modifiers significantly impact metabolite retention, peak width and intensity, the ability to separate isomers, and the long-term stability of the retention times. For instance, a HILIC column based on a trifunctionally bonded amide phase, using 10 mM ammonium formate and 0.125 % formic acid, has outperformed other mobile phase modifiers [73]. Nevertheless, when evaluating a new column, it is advised to test mobile phase modifiers differing in composition and pH to optimize separation efficiency and selectivity for a panel of expected groups of metabolites (e.g., amino acids, organic acids, biogenic amines, sugars) using a scoring system employing retention time, peak height intensity, peak width, and the ability to resolve isomers (e.g., leucine/isoleucine). Fig. 4 shows the impact of various mobile phase modifiers during HILIC–MS metabolomics analysis on the amino acid arginine in human serum extracts [73]. For RPLC–MS lipidomic profiling with a C18 column, 10 mM ammonium formate or 10 mM ammonium formate with 0.1 % formic acid in positive mode has been advised. On the other hand, using 10 mM ammonium acetate with 0.1 % acetic acid has been shown as a reasonable compromise regarding the signal intensity of the detected lipids and the stability of the retention times during long-term sequences (Fig. S2) [73].
![TrAC 2024, 180, 117940: Fig. 4. Separation of arginine ([M+H]+, m/z 175.1178) in human serum extracts using an ACQUITY UPLC BEH Amide column (50 mm × 2.1 mm i.d.; 1.7 μm particle size) coupled to an ACQUITY UPLC BEH Amide VanGuard pre-column (5 mm × 2.1 mm i.d.; 1.7 μm particle size) (Waters) under different mobile phase modifiers. Reproduced (modified) with permission from Ref. [ 73 ]. Legend: AmF, ammonium formate; FA, formic acid; AmF, ammonium formate; AmAc, ammonium acetate; NH4OH, ammonium hydroxide; AmBicarb, ammonium bicarbonate.](https://lcms.labrulez.com/labrulez-bucket-strapi-h3hsga3/Trends_in_Analytical_Chemistry_Tr_AC_2024_180_117940_Fig_4_Separation_of_arginine_M_H_m_z_175_1178_in_human_serum_extracts_using_an_ACQUITY_UPLC_BEH_Amide_column_50_mm_7315e73dc7_l.webp) TrAC 2024, 180, 117940: Fig. 4. Separation of arginine ([M+H]+, m/z 175.1178) in human serum extracts using an ACQUITY UPLC BEH Amide column (50 mm × 2.1 mm i.d.; 1.7 μm particle size) coupled to an ACQUITY UPLC BEH Amide VanGuard pre-column (5 mm × 2.1 mm i.d.; 1.7 μm particle size) (Waters) under different mobile phase modifiers. Reproduced (modified) with permission from Ref. [ 73 ]. Legend: AmF, ammonium formate; FA, formic acid; AmF, ammonium formate; AmAc, ammonium acetate; NH4OH, ammonium hydroxide; AmBicarb, ammonium bicarbonate.
TrAC 2024, 180, 117940: Fig. 4. Separation of arginine ([M+H]+, m/z 175.1178) in human serum extracts using an ACQUITY UPLC BEH Amide column (50 mm × 2.1 mm i.d.; 1.7 μm particle size) coupled to an ACQUITY UPLC BEH Amide VanGuard pre-column (5 mm × 2.1 mm i.d.; 1.7 μm particle size) (Waters) under different mobile phase modifiers. Reproduced (modified) with permission from Ref. [ 73 ]. Legend: AmF, ammonium formate; FA, formic acid; AmF, ammonium formate; AmAc, ammonium acetate; NH4OH, ammonium hydroxide; AmBicarb, ammonium bicarbonate.
For targeted LC–MS methods operated in MRM mode, evaluating the sample preparation step or SPE cleanup is recommended by monitoring highly abundant phospholipids typically occurring in biological samples [83]. To this end, using additional MRM transitions for these lipids, precursor ion scan of m/z 184, or operating the mass spec in full scan mode helps with method optimization and avoiding carry-over of these lipids or achieving separation from target metabolites. For more in-depth characterization of potentially interfering lipids, including annotation using in-silico MS/MS spectra, it is recommended to use HRMS operated in MS/MS mode with the identical LC method [84].
Current HRMS instruments for untargeted analysis usually have a linear dynamic range of about four orders of magnitude. Thus, it is necessary to determine the appropriate dilution of the extracts for injection and the typical intensity readout for the detector through an initial evaluation. To this end, serially diluted extracts are injected for a particular LC–MS platform ranging from very low to very high concentrated extracts. TOF instruments usually have an upper linearity of total ion chromatogram (TIC) limit of around 106–107, while Orbitrap instruments reach around 109. In TOF instruments, either saturation of the multichannel plate detector or reaching the analog-to-digital or time-to-digital converter limit leads to nonlinear signal behavior. In contrast, in Orbitrap instruments, highly abundant ions quickly reach the automatic gain control (AGC) target, triggering automatic ion injection into the detector. This process can potentially lead to insufficient capacity to accumulate and detect the ions. Fig. 5, which illustrates examples of lipid extracts injected within (Fig. 5A) and outside (Fig. 5B) the linear dynamic range of the detector, highlights this phenomenon. While working within the linear dynamic range for quantitative and semiquantitative analysis is crucial, utilizing (reasonably) more concentrated samples can yield additional MS/MS spectra and improve their overall quality.
![TrAC 2024, 180, 117940: Fig. 5. Examples of TIC (m/z 200–1700) of lipid extracts from human serum injected (a) within the linear dynamic range (TIC 1.2 × 10⁹) and (b) outside the linear dynamic range (TIC 4.5 × 10⁹) on the Q Exactive Plus instrument. Working within the linear dynamic range provided a linear response (R2 >0.99) for lipids when using serial dilution samples of the lipid extracts. On the other hand, the linearity for highly abundant lipids (example shown for PC 34:2, [M+H]+, m/z 758.5694) deteriorated when highly concentrated lipid extracts were injected. The ACQUITY Premier BEH C18 column (50 mm × 2.1 mm i.d.; 1.7 μm particle size) equipped with a VanGuard FIT cartridge (5 mm × 2.1 mm i.d.; 1.7 μm particle size) (Waters) was used for lipid separation with the mobile phase including (A) 60:40 acetonitrile/water with 10 mM ammonium formate and 0.1 % formic acid, and (B) 90:10:0.1 isopropanol/acetonitrile/water with 10 mM ammonium formate and 0.1 % formic acid. Further details of the RPLC–MS method can be found in Ref. [ 81 ].](https://lcms.labrulez.com/labrulez-bucket-strapi-h3hsga3/Trends_in_Analytical_Chemistry_Tr_AC_2024_180_117940_Fig_5_Examples_of_TIC_m_z_200_1700_of_lipid_extracts_from_human_serum_injected_a_within_the_linear_dynamic_range_TIC_1_2_109_36951d4eab_l.webp) TrAC 2024, 180, 117940: Fig. 5. Examples of TIC (m/z 200–1700) of lipid extracts from human serum injected (a) within the linear dynamic range (TIC 1.2 × 10⁹) and (b) outside the linear dynamic range (TIC 4.5 × 10⁹) on the Q Exactive Plus instrument. Working within the linear dynamic range provided a linear response (R2 >0.99) for lipids when using serial dilution samples of the lipid extracts. On the other hand, the linearity for highly abundant lipids (example shown for PC 34:2, [M+H]+, m/z 758.5694) deteriorated when highly concentrated lipid extracts were injected. The ACQUITY Premier BEH C18 column (50 mm × 2.1 mm i.d.; 1.7 μm particle size) equipped with a VanGuard FIT cartridge (5 mm × 2.1 mm i.d.; 1.7 μm particle size) (Waters) was used for lipid separation with the mobile phase including (A) 60:40 acetonitrile/water with 10 mM ammonium formate and 0.1 % formic acid, and (B) 90:10:0.1 isopropanol/acetonitrile/water with 10 mM ammonium formate and 0.1 % formic acid. Further details of the RPLC–MS method can be found in Ref. [ 81 ].
TrAC 2024, 180, 117940: Fig. 5. Examples of TIC (m/z 200–1700) of lipid extracts from human serum injected (a) within the linear dynamic range (TIC 1.2 × 10⁹) and (b) outside the linear dynamic range (TIC 4.5 × 10⁹) on the Q Exactive Plus instrument. Working within the linear dynamic range provided a linear response (R2 >0.99) for lipids when using serial dilution samples of the lipid extracts. On the other hand, the linearity for highly abundant lipids (example shown for PC 34:2, [M+H]+, m/z 758.5694) deteriorated when highly concentrated lipid extracts were injected. The ACQUITY Premier BEH C18 column (50 mm × 2.1 mm i.d.; 1.7 μm particle size) equipped with a VanGuard FIT cartridge (5 mm × 2.1 mm i.d.; 1.7 μm particle size) (Waters) was used for lipid separation with the mobile phase including (A) 60:40 acetonitrile/water with 10 mM ammonium formate and 0.1 % formic acid, and (B) 90:10:0.1 isopropanol/acetonitrile/water with 10 mM ammonium formate and 0.1 % formic acid. Further details of the RPLC–MS method can be found in Ref. [ 81 ].
High mass resolving power is crucial for removing potential interferences and separating isobaric compounds (e.g., compounds with the same nominal mass but different accurate masses). For example, in RPLC–MS-based lipidomics analysis, two lipids, PC P-34:1 ([M+H]+, m/z 744.5902) and PE 36:2 ([M+H]+, m/z 744.5538) are typically closely eluted [74]. A mass resolving power of at least 40,000 FWHM is required to achieve complete spectral separation of these two isobaric compounds. Therefore, low mass resolving power results in spectral co-elution, detecting these two lipids as a single mass peak with biased mass accuracy (Fig. S3).
During DDA experiments, precursor ions can be isolated within a relatively narrow window, typically 0.4–1 m/z unit, resulting in highly selective isolation. However, this narrow window often reduces the intensity of MS/MS fragments due to the lower transmission of precursor ions. Conversely, employing a wider isolation window, such as 3–4 m/z units, enhances the sensitivity of detected fragments. However, it also increases the likelihood of potential interferences, as metabolites differing in mass by 2–3 m/z units can be co-isolated (Figs. S4 and S5). This results in mixed MS/MS spectra and a worse spectral match during library search.
Since conventional DDA for acquiring MS/MS spectra is inefficient for low-abundance precursor ions, iterative exclusion-MS may help increase the total number of MS/MS scans for metabolite annotation. Usually, the pool QC sample is injected, followed by excluding precursor ions for which MS/MS were acquired; thus, in sequential injections, low-abundant precursor ions are selected for MS/MS analysis, leading to a higher metabolite annotation rate [85].
6. Processing raw files
Processing raw instrumental files usually includes feature detection, chromatogram building, deisotoping, peak alignment, and gap-filling [86,87]. Typical untargeted metabolomics and lipidomics analyses can produce hundreds of annotated metabolites and countless unknowns. A wide range of processing tools have been developed in recent years, including commercial vendor software (e.g., MarkerLynx, MarkerView, Mass Profiler Professional, MetaboScape, Compound Discoverer) or from independent developers (e.g., GeneData), open access software (e.g., XCMS, MZmine, MS-DIAL, MetAlign, IDEOM) or script platform (e.g., Matlab, R) [27]. Recently, it has been reported that the main differences among the data processing software programs were found in the number of false positive/negative peaks and gap-filling capability [88,89]. However, data quality is continuously improving through consistent software updates.
6.1. Tips and tricks
“Trust, but verify” − software that allows reviewing and curating annotated metabolites should be used to remove false positives or annotations that appear multiple times due to increased baseline for particular metabolites.
Using internal standards helps quickly assess the quality of generated data during data processing since they represent true positives in the sample. If they do not appear in the exported dataset, the cause should be investigated. This may include chromatographic or mass accuracy drift, wrong setting of data processing parameters, gross error during sample preparation, or LC malfunction.
Parameters of data processing software, such as the minimal threshold (or signal-to-noise ratio, noise level, peak amplitude), should be optimized based on the MS instrument used; otherwise, excessively noisy data may appear in the exported dataset, thereby increasing data processing time. Furthermore, the smoothing level should be chosen judiciously to prevent the generation of artifact peaks from noise or the degradation of partially coeluted peaks detected afterward as a single peak.
Spectral deconvolution (i.e., obtaining distinct peaks) of isomers is challenging during data processing, especially for partially co-eluted metabolites. When optimizing data processing settings, special attention should be given to parameters that may affect the ability to distinguish between isomers. Examples of these compounds include leucine/isoleucine, 3-hydroxybutyrate/3-hydroxyisobutyrate/2-hydroxybutyrate, citrate/isocitrate, or sugar phosphates for polar metabolites. For lipids, examples of isomers may include phosphatidylcholines (e.g., PC 36:3–5, PC 38:4–5) or triacylglycerols (e.g., TG 54:5–7), each providing multiple isomers reported in plasma during RPLC–MS lipidomics analysis [90]. Additionally, lyso-forms of phospholipids are prone to isomerization, leading to 1-acyl-2-lyso-phospholipid and 1-lyso-2-acyl-phospholipid and detected as a double peak [91]. Fig. 6 shows examples of isomers that can be used to optimize data processing parameters.
![TrAC 2024, 180, 117940:Fig. 6. Examples of isomers for optimization of data processing software: HILIC–MS metabolomic profiling: leucine and isoleucine ([M+H]+, m/z 132.1019) in human serum extract; hexose X-phosphates ([M−H]−, m/z 259.0224) in 3T3-L1 cell extract; RPLC–MS metabolomic profiling: 3-hydroxybutyrate, 3-hydroxyisobutyrate, and 2-hydroxybutyrate ([M−H]−, m/z 103.0400) in human serum extract; RPLC–MS lipidomic profiling: LPC 16:0 (LPC 0:0/16:0 and LPC 16:0/0:0, [M+H]+, m/z 496.3398), PC 36:3 (PC 18:1_18:2 and PC 16:0_20:3, [M+H]+, m/z 784.5851), TG 54:6 (TG 18:1_18:2_18:3 and TG 16:0_18:2_20:4, [M+NH4]+, m/z 896.7702) in human serum extract. The details of the LC–MS methods can be found in Ref. [ 73 ].](https://lcms.labrulez.com/labrulez-bucket-strapi-h3hsga3/Trends_in_Analytical_Chemistry_Tr_AC_2024_180_117940_Fig_6_Examples_of_isomers_for_optimization_of_data_processing_software_HILIC_MS_metabolomic_profiling_leucine_and_isoleucine_712c2662b5_l.webp) TrAC 2024, 180, 117940:Fig. 6. Examples of isomers for optimization of data processing software: HILIC–MS metabolomic profiling: leucine and isoleucine ([M+H]+, m/z 132.1019) in human serum extract; hexose X-phosphates ([M−H]−, m/z 259.0224) in 3T3-L1 cell extract; RPLC–MS metabolomic profiling: 3-hydroxybutyrate, 3-hydroxyisobutyrate, and 2-hydroxybutyrate ([M−H]−, m/z 103.0400) in human serum extract; RPLC–MS lipidomic profiling: LPC 16:0 (LPC 0:0/16:0 and LPC 16:0/0:0, [M+H]+, m/z 496.3398), PC 36:3 (PC 18:1_18:2 and PC 16:0_20:3, [M+H]+, m/z 784.5851), TG 54:6 (TG 18:1_18:2_18:3 and TG 16:0_18:2_20:4, [M+NH4]+, m/z 896.7702) in human serum extract. The details of the LC–MS methods can be found in Ref. [ 73 ].
TrAC 2024, 180, 117940:Fig. 6. Examples of isomers for optimization of data processing software: HILIC–MS metabolomic profiling: leucine and isoleucine ([M+H]+, m/z 132.1019) in human serum extract; hexose X-phosphates ([M−H]−, m/z 259.0224) in 3T3-L1 cell extract; RPLC–MS metabolomic profiling: 3-hydroxybutyrate, 3-hydroxyisobutyrate, and 2-hydroxybutyrate ([M−H]−, m/z 103.0400) in human serum extract; RPLC–MS lipidomic profiling: LPC 16:0 (LPC 0:0/16:0 and LPC 16:0/0:0, [M+H]+, m/z 496.3398), PC 36:3 (PC 18:1_18:2 and PC 16:0_20:3, [M+H]+, m/z 784.5851), TG 54:6 (TG 18:1_18:2_18:3 and TG 16:0_18:2_20:4, [M+NH4]+, m/z 896.7702) in human serum extract. The details of the LC–MS methods can be found in Ref. [ 73 ].
With new updates or versions of data processing software, their performance should be evaluated using validation data sets (instrumental files) for each platform, and data processing outcomes should be compared. This includes evaluating the total number of features, the efficiency of deconvolution of fully and partially separated isomers, and the impact on metabolite annotation, including annotation of new lipid subclasses if the new version provides such an update.
7. Metabolite annotation
Due to the structural complexity of metabolites, their annotation might be challenging [92]. Thousands of metabolite signals in a single sample can be obtained using untargeted metabolomics and lipidomics. However, only a small percentage of these signals is structurally known [93].
The Metabolomics Standardization Initiative (MSI) explains how to report and perform metabolomics workflow using a community-based guideline. MSI proposed four confidence levels: (1) identified compounds, (2) putatively annotated compounds, (3) putatively characterized compound classes, and (4) unknown compounds [94]. However, multiple researchers have initiated revisions and possible modifications of the metabolite reporting standards to fit the current needs [95,96]. In 2020, the Lipidomics Standardization Initiative (LSI) was introduced, aiming to create guidelines for lipidomics workflows, including lipid annotation guidelines based on the hierarchical concept and application of shorthand notation [97].
The experimental MS/MS libraries play one of the key roles in metabolite annotation. Various public and commercial libraries are available. The most extensive spectral library, METLIN Gen2 (metlin.scripps.edu), contains over 900,000 molecular standards with MS/MS data generated in positive and negative ionization modes at multiple collision energies, collectively containing over 4 million tandem mass spectra [98]. The next largest library updated in 2023, the National Institute of Standards and Technology (NIST) MS/MS library (chemdata.nist.gov), includes over 2.3 million spectra from over 51 thousand standards.
One of the most comprehensive free access libraries is MassBank of North America (MoNA), which allows users to download and upload MS/MS spectra freely (massbank.us). MoNA contains over 2 million MS/MS spectra records, including experimental spectra for compounds such as natural products or endogenous metabolites [27]. Other public MS/MS spectral libraries are available, such as MassBank (massbank.jp), ReSpect (spectra.psc.riken.jp), RIKEN PlaSMA (plasma.riken.jp), mzCloud (mzcloud.org), GNPS (gnps.ucsd.edu), MSforID (msforid.com), or HMBD (hmdb.ca). As an example, Fig. 7 shows the visualization of processed LC–MS data in MS-DIAL software, including MS/MS library search and annotation.
![TrAC 2024, 180, 117940: Fig. 7. Visualization of processed LC–MS data in MS-DIAL software: (1) list of processed LC–MS raw files; (2) alignment navigator; (3) peak filters; (4) peak spot viewer (spots colored based on the intensity of detected features/metabolites); (5) extracted ion chromatograms of aligned spot; (6) MS1 spectrum (full mass range of m/z 60–900); (7) details of annotated metabolite creatine in human plasma extract, showing that the difference between experimental (accurate) mass (m/z 132.07668) and calculated (exact) mass (m/z 132.0768) was as low as 0.12 mDa, passing through the MS1 accurate mass tolerance of 0.005 Da (5 mDa); (8) MS/MS spectrum acquire at stepped normalized collision energies of 20, 30, and 40 % using a Q Exactive Plus (upper panel) and reference (library) MS/MS spectrum acquire at stepped normalized collision energies of 20, 30, and 40 % using a Q Exactive HF available from MoNA (bottom panel), passing through the MS/MS accurate mass tolerance of 0.005 Da (5 mDa) as well. For separation, an ACQUITY UPLC BEH Amide column (50 mm × 2.1 mm i.d.; 1.7 μm particle size) coupled to an ACQUITY UPLC BEH Amide VanGuard pre-column (5 mm × 2.1 mm i.d.; 1.7 μm particle size) (Waters) was utilized [ 73 ].](https://lcms.labrulez.com/labrulez-bucket-strapi-h3hsga3/Trends_in_Analytical_Chemistry_Tr_AC_2024_180_117940_Fig_7_Visualization_of_processed_LC_MS_data_in_MS_DIAL_software_1_list_of_processed_LC_MS_raw_files_2_alignment_navigator_3_4214ebee31_l.webp) TrAC 2024, 180, 117940: Fig. 7. Visualization of processed LC–MS data in MS-DIAL software: (1) list of processed LC–MS raw files; (2) alignment navigator; (3) peak filters; (4) peak spot viewer (spots colored based on the intensity of detected features/metabolites); (5) extracted ion chromatograms of aligned spot; (6) MS1 spectrum (full mass range of m/z 60–900); (7) details of annotated metabolite creatine in human plasma extract, showing that the difference between experimental (accurate) mass (m/z 132.07668) and calculated (exact) mass (m/z 132.0768) was as low as 0.12 mDa, passing through the MS1 accurate mass tolerance of 0.005 Da (5 mDa); (8) MS/MS spectrum acquire at stepped normalized collision energies of 20, 30, and 40 % using a Q Exactive Plus (upper panel) and reference (library) MS/MS spectrum acquire at stepped normalized collision energies of 20, 30, and 40 % using a Q Exactive HF available from MoNA (bottom panel), passing through the MS/MS accurate mass tolerance of 0.005 Da (5 mDa) as well. For separation, an ACQUITY UPLC BEH Amide column (50 mm × 2.1 mm i.d.; 1.7 μm particle size) coupled to an ACQUITY UPLC BEH Amide VanGuard pre-column (5 mm × 2.1 mm i.d.; 1.7 μm particle size) (Waters) was utilized [ 73 ].
TrAC 2024, 180, 117940: Fig. 7. Visualization of processed LC–MS data in MS-DIAL software: (1) list of processed LC–MS raw files; (2) alignment navigator; (3) peak filters; (4) peak spot viewer (spots colored based on the intensity of detected features/metabolites); (5) extracted ion chromatograms of aligned spot; (6) MS1 spectrum (full mass range of m/z 60–900); (7) details of annotated metabolite creatine in human plasma extract, showing that the difference between experimental (accurate) mass (m/z 132.07668) and calculated (exact) mass (m/z 132.0768) was as low as 0.12 mDa, passing through the MS1 accurate mass tolerance of 0.005 Da (5 mDa); (8) MS/MS spectrum acquire at stepped normalized collision energies of 20, 30, and 40 % using a Q Exactive Plus (upper panel) and reference (library) MS/MS spectrum acquire at stepped normalized collision energies of 20, 30, and 40 % using a Q Exactive HF available from MoNA (bottom panel), passing through the MS/MS accurate mass tolerance of 0.005 Da (5 mDa) as well. For separation, an ACQUITY UPLC BEH Amide column (50 mm × 2.1 mm i.d.; 1.7 μm particle size) coupled to an ACQUITY UPLC BEH Amide VanGuard pre-column (5 mm × 2.1 mm i.d.; 1.7 μm particle size) (Waters) was utilized [ 73 ].
In addition, the MS/MS spectral library can annotate simple and complex lipids (included in MS-DIAL and MZmine) or be available in a mass searchable format (MSP) for other data processing software (downloaded from MoNA). These in-silico libraries were created since many lipids break in an MS/MS experiment predictably, leading to fragmentation rules. These rules were then applied to lipid structures generated using in-silico methods to yield a comprehensive lipidomics library for compound annotations [99].
Furthermore, most libraries are not specific for metabolites and include MS/MS spectra for other small molecules (e.g., food additives, pharmaceutical drugs, pesticides). Additionally, attention should be paid to the applied mass analyzers (e.g., QTOF or Orbitrap), collision energy, concentration and purity of chemical standards, and other experimental conditions because different libraries were acquired using different parameters [100]. Recently, Hoang et al. conducted cross-platform compassion (using QTOFs from Agilent, Bruker, SCIEX, Waters, and Orbitrap from Thermo) and tested collisional energies at 0, 10, 20, and 40 eV. They suggested that a collision energy of 20 eV provides optimal congruency and could significantly enhance uniformity and sensitivity, ultimately enhancing the accessibility and reproducibility of scientific data [101].
Another method that can be considered for compound annotation is IM-MS and LC–IM-MS. IM-MS provides an additional physicochemical property, CCS (collision cross section), which can be used for compound annotation and identification [102]. Coupling LC–MS with ion mobility separation (LC–IM-MS) improves the accuracy of metabolite annotation. It can also help with the process by improving peak capacity and resolving power, reducing the matrix effect, and increasing signal-to-noise ratios of metabolites [100]. Multiple experimental CCS databases for small molecules have been introduced [84,103,104].
It is estimated that only 10–20 % of molecular features detected during untargeted LC–MS-based metabolomics can be annotated according to mass spectra library matches [105]. In the next step, computational simulations predict the mass spectra from input structures, aiming to increase the annotation rate [106]. Various in-silico fragmentation software programs (Mass Frontier, CSI:FingerID, CFM-ID, MS-FINDER, MIDAS-G, and MetFrag) are used to determine these chemical structures [107]. Internal compound databases (e.g., HMDB, hmdb.ca
; PubChem, pubchem.ncbi.nlm.nih.gov) provide putative chemical structures for “known unknowns” (i.e., existing but not yet identified or characterized metabolites). For “unknown unknowns” (i.e., completely unknown and uncharacterized metabolites), in-silico tools for generating new metabolite structures (e.g., MINE, minedatabase.mcs.anl.gov; BioTransformer, biotransformer.ca) or network-based approaches (e.g., Global Natural Product Social Molecular Networking, gnps.ucsd.edu
) are available to complement the metabolite coverage [108]. Furthermore, additional orthogonal filters can be based on retention time prediction [109,110] or hydrogen/deuterium exchange mass spectrometry (HDX-MS) [111,112].
7.1. Tips and tricks
Typical metabolomics reports distinguish between Level 1 (matching based on retention time, MS1, and MS/MS spectrum) and Level 2 (matching based on MS1 and MS/MS spectrum). In Level 1, the term “identified” is used, whereas “annotated” is the appropriate terminology in the latter case [94]. Annotation based only on matching MS1 accurate mass (Level 3) may lead to many misannotations.
As a common standard, the metabolite should be annotated with MS1 accurate mass and MS/MS spectra, which removes many false positive annotations. Using data processing software and spectral libraries, this is performed using settings such as narrow mass tolerance (e.g., ±0.005 Da) for MS1 precursor ions and MS/MS fragments and calculating similarity scores (e.g., dot product, reversed dot product). On the other hand, even a combination of MS1 and MS/MS for metabolite annotation can be inefficient, especially for isomeric compounds such as hexose phosphates, citrate/isocitrate, or leucine/isoleucine with identical or very similar MS/MS spectra, thus, requiring retention time information for proper annotation [28].
During LC–MS-based metabolomics analysis, thousands of molecular features are detected in biological samples per analysis. These molecular features do not necessarily correspond to unique metabolites; they include isotopes, adducts, artifacts, and contaminants. For instance, Fig. 8A and B show an example of triacylglycerol TG 50:2 detected as multiple adducts ([M+NH4]+, [M+Na]+, [M+K]+, [2M+NH4]+, [2M+Na]+), each with multiple isotopes, resulting in 21 molecular features. Furthermore, in-source fragmentation, which leads to diacylglycerol fragment ions (Fig. 8C), contributed eight additional molecular features. While adducts can be annotated based on typical mass differences, annotating in-source fragments can be more challenging. However, these fragments are typically chromatographically coeluted, exhibit the same peak shape, correlate in peak intensities across samples, and have similar statistical outcomes as molecular ions. They may also coincide with those obtained during MS/MS analysis (Fig. 8D). This underscores the importance of proper data processing and curation to yield a concise list of unique metabolites and relevant molecular features for statistical analysis. Furthermore, it has been shown that a systems-level annotation of a metabolomics dataset can reduce 25,000 molecular features to fewer than 1000 unique metabolites [113].
![TrAC 2024, 180, 117940: Fig. 8. Detection of TG 50:2 during RPLC–ESI(+)-MS lipidomic profiling [ 81 ] of human serum extract: (a) intensity of [M+NH4]+, [M+Na]+, [M+K]+ adducts and their isotopes; (b) intensity of [2M+NH4]+, [2M+Na]+ adducts and their isotopes; (c) intensity of in-source fragments of TG 50:2; (d) MS/MS spectrum (fragments) of TG 50:2 (precursor ions m/z 848.7692, retention time 5.24 min) leading to annotation of this TG as a mixture of TG 16:0_16:1_18:1 and TG 16:0_16:0_18:2 using MS-DIAL [ 84 ].](https://lcms.labrulez.com/labrulez-bucket-strapi-h3hsga3/Trends_in_Analytical_Chemistry_Tr_AC_2024_180_117940_Fig_8_Detection_of_TG_50_2_during_RPLC_ESI_MS_lipidomic_profiling_of_human_serum_extract_a_intensity_of_M_NH_4_M_Na_18b804aba3_l.webp) TrAC 2024, 180, 117940: Fig. 8. Detection of TG 50:2 during RPLC–ESI(+)-MS lipidomic profiling [ 81 ] of human serum extract: (a) intensity of [M+NH4]+, [M+Na]+, [M+K]+ adducts and their isotopes; (b) intensity of [2M+NH4]+, [2M+Na]+ adducts and their isotopes; (c) intensity of in-source fragments of TG 50:2; (d) MS/MS spectrum (fragments) of TG 50:2 (precursor ions m/z 848.7692, retention time 5.24 min) leading to annotation of this TG as a mixture of TG 16:0_16:1_18:1 and TG 16:0_16:0_18:2 using MS-DIAL [ 84 ].
TrAC 2024, 180, 117940: Fig. 8. Detection of TG 50:2 during RPLC–ESI(+)-MS lipidomic profiling [ 81 ] of human serum extract: (a) intensity of [M+NH4]+, [M+Na]+, [M+K]+ adducts and their isotopes; (b) intensity of [2M+NH4]+, [2M+Na]+ adducts and their isotopes; (c) intensity of in-source fragments of TG 50:2; (d) MS/MS spectrum (fragments) of TG 50:2 (precursor ions m/z 848.7692, retention time 5.24 min) leading to annotation of this TG as a mixture of TG 16:0_16:1_18:1 and TG 16:0_16:0_18:2 using MS-DIAL [ 84 ].
Repeated annotations of some metabolites in LC–MS can be due to in-source artifact formation; for instance, glutamine and glutamic acid generate an in-source artifact by cyclizing to pyroglutamic acid (Fig. S6) [114]. Further, when the intensity of a particular metabolite is too high, the tailing peak may lead to additional annotations of the same metabolite (Fig. S7), which should be removed during data curation.
Complex lipids are reported based on the structural resolution from MS1 and MS/MS analysis, such as carbons and double bonds (e.g., PC 36:2) and fatty acyl constituents (e.g., PC 18:0_18:2). The use of the underscore “_” means that there is certainty in the composition of the fatty acyl constituents, but not their placement on the glycerol backbone [115]. Lipid annotation, where the positional isomeric level of the fatty acyl chains (sn1 and sn2) is known, is indicated by a slash “/” (e.g., PC 18:0/18:2).
Some lipids consist of a mixture of two or even more lipid isomers with the same number of carbon atoms and double bonds but differing in acyl chain lengths (e.g., TG 52:3; TG 16:1_18:1_18:1 and TG 16:0_18:1_18:2, Fig. S8). Such coelutions unavoidably occur during LC–MS-based lipidomic profiling. In such instances, the software typically annotates the specific lipid with the acyl chain composition most similar to the in-silico MS/MS spectrum. However, other possible compositions may also be considered during data curation [99].
Isomeric bis(monoacylglycero)phosphate (BMP) and phosphatidylglycerol (PG) species can be detected in positive (as [M+NH4]+) and negative (as [M−H]−) ion modes using LC−MS. However, only the positive mode provides MS/MS spectra for reliable differentiation, while the negative mode provides identical MS/MS spectra for both lipid subclasses (Fig. S9) [84].
Proposed guidelines on the expected fatty acyl chains in the major species of phospholipids, glycerolipids, and sphingolipids in mammalian samples should be checked to assess the likelihood of particular lipid species [116].
During structure elucidation, the first step is properly annotating the ion form (adduct). Since multiple ion forms can be formed during ESI, it is suggested that ions with characteristic differences be explored to confirm particular adducts. In ESI(+), typically [M+H]+, [M+NH4]+, [M+Na]+, and [M+K]+ species are formed. A mass difference of 21.9819 m/z indicates the presence of [M+H]+ and [M+Na]+, while a mass difference of 4.9554 m/z shows the presence of [M+NH4]+ and [M+Na]+. In ESI(−), [M−H]−, [M+Cl]−, and [M+HCOO]−/[M+CH3COO]− based on mobile phase modifiers can be observed. Thus, a mass difference of 35.9767 m/z indicates [M−H]− and [M+Cl]−, while mass differences of 46.0055 and 60.0211 m/z are observed for [M−H]− and [M+HCOO]−/[M+CH3COO]− ions, respectively. Additionally, it is useful to compare data acquired in both ionization modes. For instance, if a mass difference of 2.0146 m/z is observed, the molecule forms both [M+H]+ and [M−H]− ions.
The isotopic pattern of an unknown molecule with a suggested ion form should then be submitted to an in-silico software program to determine its elemental composition. In this step, the mass tolerance filter (e.g., 0.005 Da), isotopic ratio tolerance, selected elements, and selection of internal databases will significantly impact the number of possible formulae reported. Next, the MS/MS spectrum is used to generate a list of isomeric (scored) candidate structures from compound databases based on applied in-silico fragmentation rules (Fig. S10).
A list of candidate structures can be reduced by applying HDX-MS. Exchangeable hydrogen atoms, bound to heteroatoms such as oxygen, nitrogen, and sulfur, readily exchange with deuterium, while those bound to carbon remain unaltered. When metabolites are exposed to deuterium-containing solvents (e.g., H2O → D2O; methanol → methanol-OD or methanol-D4; isopropanol → isopropanol-OD or isopropanol-D8) and mobile phase modifiers (e.g., formic acid → D2-formic acid; ammonium formate → D5-ammonium formate), labile hydrogens within various functional groups (−NH−, –NH2, –OH, –COOH, –SH) are substituted with deuterium [112]. The number of replaced hydrogens in the molecule can be determined by measuring the molecular mass before and after HDX (Fig. S11) using a mass spectrometer. As a final step, validation should be performed by analyzing authentic standards under the same LC–MS conditions and comparing retention times, MS1, and MS/MS spectra...
The rest of the article is available on the original website
- Tips and tricks for LC–MS-based metabolomics and lipidomics analysis. Stanislava Rakusanova, Tomas Cajka. TrAC Trends in Analytical Chemistry 2024, 180, 117940. https://doi.org/10.1016/j.trac.2024.117940.


