Assessment of LC-QTOF-MS data independent acquisition for quantification and suspect screening of pesticides in agriculture impacted water samples

Journal of Chromatography A, Volume 1751, 2025, 465957: Fig. 7. A and B, database product ion spectra of atrazine-2‑hydroxy and desethyl terbumeton, respectively. C, MS spectrum corresponding to a standard of the first compound in ultrapure water (200 ng l-1). D, Clean (up) and raw (down) pseudo-MS/MS spectra associated to the peak of atrazine-2‑hydroxy from DIA data.
The goal of the study was to evaluate the performance of data independent acquisition (DIA) using LC-QTOF-MS for both quantification of known pesticides and suspect screening of additional compounds in surface and groundwater affected by agriculture. The method was designed to operate from a single chromatographic run and included an online solid-phase extraction step for improved sensitivity.
A range of commonly used fungicides and insecticides in viticulture was tested to validate the approach. The method showed strong quantification capabilities with low detection limits and good accuracy, while the DIA mode significantly improved the identification of suspect compounds compared to the conventional data dependent acquisition (DDA) mode.
The original article
Assessment of LC-QTOF-MS data independent acquisition for quantification and suspect screening of pesticides in agriculture impacted water samples
V. Fernández-Fernández, G. Castro, M. Ramil, I. Rodríguez
Journal of Chromatography A, Volume 1751, 2025, 465957
https://doi.org/10.1016/j.chroma.2025.465957
licensed under CC-BY 4.0
Selected sections from the article follow. Formats and hyperlinks were adapted from the original.
Plant protection chemicals play a key role to meet the increasing global demand for cost affordable food. Application rates of herbicides can be reduced under certain agronomic practices, such as tilling and use of mulching films, which minimize the impact of weeds in the productivity of crops [1,2]. Conversely, the application of fungicides and insecticides is unavoidable to prevent losses caused by fungal infections and insect attack on crops. Industrialized agricultural practices, added to unintentional spills and the misuse of agrochemicals, might result in the contamination of surface water (SW) courses from rural areas [[3], [4], [5], [6]]. Ground water (GW) is not exposed directly to agricultural pesticides; however, permeable soils and leachable, water stable compounds, i.e. species with groundwater ubiquity score (GUS) values above 2.8, are factors contributing to the exchange of pesticides between SW and GW [7]. Triazine-type herbicides, neonicotinoid insecticides, in particular imidacloprid, and medium polarity fungicides, such as metalaxyl and its transformation product CGA62826, have been often reported in SW [5] and GW [8] from agricultural impacted areas [9]. Concern regarding the impact of pesticides on the aquatic environment is reflected in the inclusion of several compounds in the EU Watch List of micropollutants to be monitored in SW [10].
Assessing the presence of authorized and legacy pesticides in GW and SW requires sensitive, multiresidue analytical approaches. Currently, most procedures are based on the combination of liquid chromatography (LC) with mass spectrometry (MS), either with direct injection of large volume water samples [9,11], or following a preconcentration step [12], allowing a reduction of procedural limits of quantification (LOQs) and, sometimes, reducing the complexity of the sample matrix, as in case of solid-phase extraction (SPE).Tandem mass spectrometry (MS/MS), using triple quadrupole (QqQ) instruments, offers unmatched performance in terms of sensitivity and selectivity based on the connection between precursor and product ions, recorded at collision energies maximizing the intensity of each transition. Therefore, LC-QqQ-MS is regarded as the workhorse for ultra-trace quantification of target pesticides in the aquatic environment [[12], [13], [14], [15], [16]]. Accurate MS instruments, i.e. time-of-flight (TOF) and Orbitrap MS analyzers, are the preferred choice for the screening of unknowns due to the huge volume of information associated to scan records (accurate MS and product ion spectra), combined with the different operational modes offered by these analyzers [[17], [18], [19]]. Availability of accurate spectral data is particularly important in the case of pesticides, where the list of authorized and withdrawn substances is constantly updated in response to different issues such as pest resistance, environmental impact and/or identification of concerning transformation products. Thus, the sequential application of target and screening methodologies to environmental samples provides a comprehensive understanding of pesticides and their potential transformation products in aquatic environments influenced by agricultural activities [5].
Nowadays, analytical chemists face the challenges of quantifying target aquatic micropollutants in the range of the low ng per litre and generating information suitable to be used for screening studies, in a cost-effective way [20]. In other words, to produce quantitative and qualitative data, within a short acquisition time, to enhance the productivity of expensive MS equipment. In this context, the goal of this manuscript was to assess the performance of a medium range LC-QTOF-MS platform for the automated quantification of a preselection of pesticides (fungicides and insecticides) in SW and GW, together with the screening of suspect targets in the same chromatographic analysis. To this end, the LC-QTOF-MS instrument was operated in the data independent acquisition (DIA) mode [19,21,22]. Concentration of water samples was carried out by on-line combination of SPE with the LC-QTOF-MS system. Suspect screening possibilities were assessed using a database with accurate product ion spectra for more than 700 pesticides, recorded at three different collision energies. The study aims identifying those variables affecting the performance of the DIA mode for the sensitive quantification of target compounds, and the capabilities of the system for compounds identification in water samples spiked at different concentration levels, using a fully automated analytical procedure, operating within a 30 min data acquisition window.
2. Material and methods
2.3. On-line sample concentration and determination conditions
The volume of water sample load in the SPE cartridge, on-line connected to the LC column, was 0.4 mL. Details regarding the program of the SPE valve, and the gradient of the auxiliary pump, employed to transfer the sample in the SPE sorbent, are given elsewhere [23]. Separation of desorbed compounds was carried out in a C18-type column (Zorbax Eclipse XDB-C18, 100 mm x 2.1 mm, 3.5 µm) purchased from Agilent. Mobile phases consisted of ultrapure water and ACN, both 0.1 % in FA, at a flow rate of 0.3 mL min-1. The temperature of the column was maintained at 30 °C, and the composition of the mobile phase programmed as follows: 0–4 min (15 % B), 16–17 min (85 % B), 17.1–19 min (100 % B), 19.1–25 min (15 % B). The chromatographic separation step was completed within 25 min, including desorption of the on-line SPE cartridge, compounds separation and column re-equilibration. Loading the SPE sorbent with the water sample required around 5 min.
The on-line SPE LC system was connected to an Agilent 6550 QTOF-MS instrument through an electrospray (ESI) source, operated in the positive ionization mode (ESI+). ESI needle, nozzle and fragmentor voltages were set at 2500 V, 500 V, and 120 V, respectively. The QTOF-MS was operated in the data independent acquisition (DIA) mode, recording a minimum of two distinct functions, one with the collision cell inactive (MS1 function) and the others using different collision energies (pseudo-MS/MS functions). The total data acquisition cycle was set at 1 s, equally divided between the number of employed functions. Spectral data were recorded in the range of m/z values between 40 and 1200 Da. Mass resolution varied between 18,000 and 22,000 for ions with m/z values of 322 and 622, respectively. Accuracy of m/z values during data acquisition was guaranteed by continuous recalibration of the mass axis using reference ions at 121.0508 and 922.0098 Da. Some additional spectral data were acquired in the auto MS/MS mode to compare the screening efficiencies of data dependent acquisition (DDA) and DIA approaches. During DDA experiments, a maximum of 5 precursor ions were isolated and fragmented using collision energies of 20 eV and 40 eV. Selected precursor ions were released after recording 2 spectra at each collision energy. Signal acquisition rates were 3 Hz and 15 Hz for MS and MS/MS functions, respectively. Additional parameters of the DDA mode are given as supplementary information, Text S1. Instrument control, data acquisition and data processing (quantification of target compounds, and data mining from DIA and DDA records) were carried out using Agilent MassHunter software.
3. Results and discussion
3.3. Performance of DIA for screening purposes
The efficiency of on-line SPE-LC-QTOF-MS DIA data for suspect screening purposes was evaluated in three different matrices spiked with the suite of model pesticides considered in the study. Data mining was carried out as reported in section 3.4, without considering retention time information. Fig. 5A shows the percentage of positively identified compounds as function of water type and added concentration. Except for the lowest addition level (10 ng l-1), the number of positive identifications was hardly affected by the water matrix. The success of the screening methodology increased between 10 ng l-1 and 50 ng l-1. As for the latter concentration, between 40 and 42, out of 44 species, could be confirmed without retention time information. For the selection of pesticides, the DIA data mining workflow did not produce false positives; however, some limitations of the methodology were noticed. As example, fenhexamide and tebuconazole led systematically to false negatives. The first compound did not generate fragments with S/N values above 5 in the pseudo-MS/MS channels, to qualify identifications derived from pseudo-molecular ions recorded in the MS1 function, figure not shown. The product ion spectra of tebuconazole (C16H22ClN3O) contained a single intense fragment at m/z 70.0402, assigned to the triazole ring ([C2N3H4]+). As this fragment was common to tetraconazole (C13H11Cl2F4N3O), and both compounds were not baseline separated (retention times 12.53 and 12.61 min for tetraconazole and tebuconazole, respectively, Table 1), the coelution score between the [M + H]+ and the fragment ion of tebuconazole (m/z values of 308.1524 and 70.0402) remained below the 90 % threshold set for confirmation purposes Fig. 5B
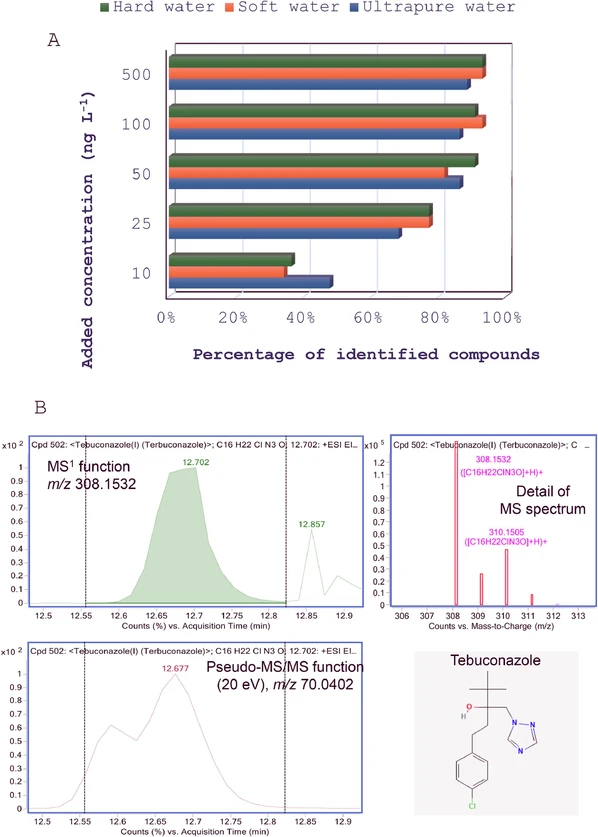 Journal of Chromatography A, Volume 1751, 2025, 465957: Fig. 5. A, Percentage of positively identified compounds from DIA data in three water matrices as function of added concentration. B, Tentative identification of tebuconazole in a multianalyte spiked sample (100 ng l-1 per compound) from its MS spectrum, not confirmed due to poor coelution between the pseudo-molecular ion (m/z 308.1532) and the fragment one (m/z 70.0402), partially coeluted with same fragment corresponding to another azolic fungicide (tetraconazole).
The problem depicted in Fig. 5B might be solved using a QTOF-MS platform enabling to operate in the SWATH-MS (sequential window acquisition of all theoretical mass spectra) mode, under the condition that precursor ions of both fungicides are included in two different m/z windows [25]. However, a potential drawback of SWATH-MS is that the signal acquisition rate needs to be increased proportionally to the number of sequential mass windows. As commented in Section 3.1, in case of QTOF-MS analyzers, the intensity of responses is inversely proportional to data acquisition rates. Considering 8 sequential windows, between the m/z values of the protonated ions for lighter and heavier pesticides involved in the study (carbendazim and cyflufenamid, respectively), the signal acquisition frequency in each of the two pseudo-MS/MS functions should be increased from 3 Hz (the value set in this study) to 24 Hz. Simulation of these conditions (increase of data acquisition rate from 3 Hz to 24 Hz), using the QTOF-MS platform of our study, produced a reduction of 80 % in the intensity of chromatographic peak for fragment ions.
The performance of DIA mode for screening purposes was compared to that provided by DDA. Fig. S6 summarizes the percentage of positively identified compounds by DDA in the same aliquots of samples considered during DIA experiments, spiked at the environmental quality standard (100 ng l-1). For a single injection, on average 70 % of compounds were identified considering a minimum value for the normalized reversed score of 50 %. When three consecutive analyses of each sample were carried out, the above percentage increased slightly to an average value of 78 %, still below the 90 % percentage achieved for the same concentration level in DIA, Fig. 5A. The advantage of the latter mode was a 3 times higher sample throughput. The main reasons for false negatives in DDA mode were the low signal of the precursor ions for some compounds, so they were not selected for fragmentation in the collision cell in any of the three consecutive analyses; and a poor match between the experimental MS/MS spectrum and those compiled in the employed spectral database. Despite DDA produces authentic product ion spectra (at difference with DIA, the link between precursor and product ions is not lost), the use of fast acquisition rates to record MS/MS data results in low S/N ratios for product ions.
Fig. 6 summarizes the identification of the desethyl metabolite of atrazine in a non-spiked GW sample combining the data obtained by on-line SPE-LC-QTOF-MS DIA with the suspect screening data mining. The EIC for the [M + H]+ ion of the compound, and the MS1 spectrum are shown in Fig. 6A and B, respectively. The normalized score of the MS1 spectrum (calculated considering mass accuracy, isotopic profile and abundance) was 97.3 %. Raw and cleaned spectra for fragment ions recorded in the pseudo-MS/MS functions are shown in Fig. 6C. Ions at nominal m/z values of 68, 79, 104 and 146 matched those in the database spectra of desethyl atrazine, with mass differences lower than 1 mDa, see Fig. S7. That is, four out of six product ions in the database spectra of desethyl atrazine were noticed in the cleaned pseudo-MS/MS spectrum. Finally, the tentative identification derived from the suspect screening was confirmed with a standard of desethyl atrazine. The experimental product ion spectra for a 500 ng l-1 standard of desethyl atrazine in UW is shown in Fig. 6D
![Journal of Chromatography A, Volume 1751, 2025, 465957: Fig. 6. Identification of desethyl atrazine in a non-spiked sample of ground water. A, EIC chromatogram for the pseudo molecular ion ([M + H]+) of the compound. B, experimental (green) and theoretical (boxes in red) MS spectra of the candidate species. C, raw (down) and cleaned (up) spectra with fragment ions compatible with the database product ion spectrum of desethyl atrazine. D, experimental MS/MS spectrum for a standard of desethyl atrazine (500 ng l-1 in ultrapure water) using a collision energy of 20 eV.](https://lcms.labrulez.com/labrulez-bucket-strapi-h3hsga3/Journal_of_Chromatography_A_Volume_1751_2025_465957_Fig_6_Identification_of_desethyl_atrazine_in_a_non_spiked_sample_of_ground_water_cbafc0fdc7_l.webp) Journal of Chromatography A, Volume 1751, 2025, 465957: Fig. 6. Identification of desethyl atrazine in a non-spiked sample of ground water. A, EIC chromatogram for the pseudo molecular ion ([M + H]+) of the compound. B, experimental (green) and theoretical (boxes in red) MS spectra of the candidate species. C, raw (down) and cleaned (up) spectra with fragment ions compatible with the database product ion spectrum of desethyl atrazine. D, experimental MS/MS spectrum for a standard of desethyl atrazine (500 ng l-1 in ultrapure water) using a collision energy of 20 eV.
Journal of Chromatography A, Volume 1751, 2025, 465957: Fig. 6. Identification of desethyl atrazine in a non-spiked sample of ground water. A, EIC chromatogram for the pseudo molecular ion ([M + H]+) of the compound. B, experimental (green) and theoretical (boxes in red) MS spectra of the candidate species. C, raw (down) and cleaned (up) spectra with fragment ions compatible with the database product ion spectrum of desethyl atrazine. D, experimental MS/MS spectrum for a standard of desethyl atrazine (500 ng l-1 in ultrapure water) using a collision energy of 20 eV.
During application of DIA screening methodology to non-spiked samples, it was observed that the probability of misidentifications depended on the existence of database entries with similar features. Compounds with the same empirical formula, and some common fragments in their product ion spectra led to multiple, not prioritized identifications. This is the case of the hydroxylated transformation products of chlorinated triazine herbicides and their methoxylated analogues. The above situation is exemplified for the pair of pesticide transformation products 2‑hydroxy atrazine and desethyl terbumeton. Both compounds present the same empirical formula (C8H15N5O), and product ion spectra with common (nominal m/z values 86 and 69) and different (m/z 114, 142 and 156) fragments, Fig. 7A and B The MS, the raw and the cleaned product ion spectra obtained for a sample of UW spiked with 2‑hydroxy atrazine at 200 ng l-1, using DIA mode, are shown in Fig. 7C and D The cleaned high collision spectrum contains 4 and 2 of the product ions existing the spectral database for 2‑hydroxy atrazine and desethyl terbumeton, respectively. However, the Find by Formula algorithm employed by MassHunter software did not include any function to prioritize the best candidate attending to the number of qualifier fragments. Thus, in case of a non-spiked sample, additional inspection of data by the operator is required to select the best match.
Journal of Chromatography A, Volume 1751, 2025, 465957: Fig. 7. A and B, database product ion spectra of atrazine-2‑hydroxy and desethyl terbumeton, respectively. C, MS spectrum corresponding to a standard of the first compound in ultrapure water (200 ng l-1). D, Clean (up) and raw (down) pseudo-MS/MS spectra associated to the peak of atrazine-2‑hydroxy from DIA data.
4. Conclusions
Performance of DIA LC-QTOF-MS is impacted by data acquisition rate and number of recorded pseudo-MS/MS functions, with the best balance between sensitivity and qualitative information achieved considering two different collision energies simultaneously recorded to the MS1 function, at 3 Hz per channel. The on-line combination with a SPE step permitted the automated quantification of a selection of 44 pesticides in samples of surface and ground water with limits of quantification in the range from 2 ng l-1 to 25 ng l-1. Match of retention times and m/z values measured in the MS1 function are implemented with qualifier ions (as a rule from one of the pseudo-MS/MS functions) for quantification of selected targets. The success of suspect screening, without retention time information, remained above 90 % for water samples spiked at concentrations equal or higher than 50 ng l-1, improving the rate of the DDA mode for same water matrices. In case of substances with same empirical formula and some common product ions, further improvements in the data mining software are still required to allow prioritization of qualified compounds attending to the number of confirmed fragments.