New study reveals how textiles trap harmful chemicals

Environ. Sci. Processes Impacts, 2025,27, 1054-1062: Fig. 1 Scheme of apparatus used for measurement of KTA of AAs; 1- textile pieces before wrapping to the chamber mesh (Fig S1†), 2- glass chamber with a ground joint lid, mesh and airtight seal, 3- steel capillary pierced through a septum for air intake, 4- metal clamp, 5- small fan, 6- two glass tubes filled with Tenax adsorbent, in series, 7- air mass flow meter, 8- low volume air pump.
Have you ever considered hidden chemicals in your clothing and home textiles? The latest research of scientists from RECETOX, Masaryk University (Brno, Czech Republic), and the Helmholtz Centre for Environmental Research (Leipzig, Germany) reveals how various fabrics absorb and release harmful aromatic amines (AAs) compounds linked to cancer and other health risks. This research is especially important because by studying the most common fabric types, we can better predict how these chemicals behave in indoor environments.
 Recetox: New study reveals how textiles trap harmful chemicals: Figure 1. Fabric's microscopic pictures, A – cotton, B – polyester, C – wool
What Are Aromatic Amines and Why Should We Care?
Aromatic amines (AAs) are harmful chemicals found in everyday products like hair dyes, rubber materials, and tobacco smoke. “Indoor activities such as protein-enriched foods and smoking release these compounds into the air, directly impacting human health. While regulations restrict some AAs due to their toxicity, others remain widely used . Long-term exposure increases the risk of cancer and other serious health problems,” explains first author of the study Özge Edebali.
Surprisingly, textiles can trap AAs from the air and later release them, contributing to indoor pollution. Since we spend most of our time indoors, understanding how different fabrics interact with AAs can help us reduce exposure and improve indoor air quality. Moreover, washing contaminated fabrics can also send these chemicals into wastewater, threatening aquatic ecosystems.
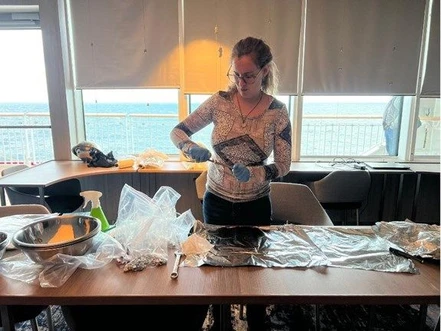
“The research tested how different textiles—cotton, wool, and polyester—absorb and release AAs indoors. The test was conducted in a specially designed chamber, where different textiles were exposed to AAs. Afterward, AAs were measured in textiles and in the air as well. The finding is that cotton absorbed the highest levels, making it a significant source of chemical exposure,” says Özge Edebali.
These everyday fabrics act as hidden reservoirs, transferring pollutants into indoor air and even our waterways through laundry. Understanding this process is key to reducing exposure and creating safer indoor environments.
The project results were created with the financial support of the provider Czech Science Foundation within the project no.GF22-06020K and Deutsche Forschungsgemeinscha (DFG, German Research Foundation) – MU 4728/2-1. The authors thank the RECETOX Research Infrastructure (LM2023069) financed by The Ministry of Education, Youth and Sports for a supportive background. This work was supported by the European Union's Horizon 2020 research and innovation program under grant agreement no. 857560 (CETOCOEN Excellence).
The original article
Characterizing the distribution of aromatic amines between polyester, cotton, and wool textiles and air
Özge Edebali, Anna Goellner, Marek Stiborek, Zdeněk Šimek, Melis Muz, Branislav Vrana and Lisa Melymuk
Environ. Sci.: Processes Impacts, 2025,27, 1054-1062
https://doi.org/10.1039/D5EM00015G
licensed under CC-BY 3.0
Selected sections from the article follow. Formats and hyperlinks were adapted from the original.
2 Materials and methods
2.1. Determination of textile–air distribution coefficients
The purpose of the experiment was to determine textile–air distribution coefficients of selected AAs (Table S2†) under laboratory conditions as a ratio of concentration in the textile fabric and concentration in the adjacent air under equilibrium conditions. The experiment was performed by extracting AAs (by trapping on Tenax® TA sorbent) from a defined volume of air that was in contact with a piece of textile containing a range of AAs inside an exposure chamber. Following each textile's exposure to air, concentrations of AAs in the textile sample were determined after solvent extraction of the textile.
The experimental apparatus consisted of a textile exposure chamber consisting of a three-litre glass cylinder with a flat bottom and a ground-joint flange lid (Fig. 1). The exposure chamber was designed with a threaded air inlet in the lid, implemented as a steel capillary pierced through a septum, and an air outlet at the bottom. The chamber operated in a flow-through setup, meaning it was not a closed system. We assumed that the dosing rate of the textile (in terms of air volume equivalent per unit of time) was significantly higher than the airflow rate. Consequently, the chamber conditions were maintained close to a textile/air distribution equilibrium. A wire mesh sheet was rolled up inside the chamber, serving as a framework to support a piece of the tested textile. A small fan inside the chamber was used to homogenize the air inside the chamber and minimize the air boundary layer at the surface of the textile. The chamber was kept at a constant temperature of 25 °C through an external thermostatic water circuit.
Environ. Sci. Processes Impacts, 2025,27, 1054-1062: Fig. 1 Scheme of apparatus used for measurement of KTA of AAs; 1- textile pieces before wrapping to the chamber mesh (Fig S1†), 2- glass chamber with a ground joint lid, mesh and airtight seal, 3- steel capillary pierced through a septum for air intake, 4- metal clamp, 5- small fan, 6- two glass tubes filled with Tenax adsorbent, in series, 7- air mass flow meter, 8- low volume air pump.
Two glass tubes packed with Tenax® TA (Gerstel, Germany) were connected in series to the chamber outlet to trap AAs from the air extracted from the exposure chamber. Air was drawn from the apparatus through the Tenax tubes using a low-volume air pump connected to a digital air mass flow controller (Omega FMA-A2404, USA) adjustable in the 0–200 standard cubic centimetres per minute (sccm) range.
2.2. Textile and Tenax preparation
Tenax tubes (Tenax® TA thermal desorption tubes, 6 × 60 mm, Gerstel, Germany) were pre-cleaned before each experiment with methyl tert-butylether (MTBE, 12 h, Soxhlet extraction). After solvent cleaning, tubes were placed into a tube conditioner (Gerstel TC2, Gerstel, Germany) and dried for 2 h in a pure nitrogen stream at 300 °C.
Three types of textile materials were tested: wool, cotton, and polyester. All textiles were white/undyed materials; detailed information is provided in ESI Fig. S2, Text S1 and Table S1.† The purchased textile fabrics were cut into larger sheets (27 × 32 cm; area of 864 cm2 each), pre-cleaned (cleaned in water in overhead tumbler) and dried (Text S1 and Fig. S3†). Textiles were then dosed with a mixture of 19 primary AA compounds (Table S2†). The dosing procedure in a rotary evaporator was selected after testing different dosing methods to ensure homogeneously dosed textile samples (Text S2 and Fig. S4–S7†). The selected AAs were diluted in acetone by spiking 1 mL of AA standard (for the spiked masses of each analyte see Table S3†) in approximately 200 mL of acetone in a round rotary evaporator flask and mixed by shaking for 5 minutes. Next, the textile sheet was added to the acetone-filled flask. The textile samples were dosed for 6 hours while turning on a rotary evaporator (270 rpm, 25 °C at normal pressure). Subsequently, acetone was evaporated (556 mbar, 40 °C) while continuing the flask rotation, a process taking 1 hour to achieve complete dryness. After dosing, the textile samples were stored in the closed rotary evaporator flask at 4 °C until they were transferred to the exposure chamber.
2.5. Analysis
The chromatographic separation of target compounds in the textile and Tenax extracts was performed using a liquid chromatograph (Agilent 1290 II LC System, Agilent Technologies, Santa Clara, CA) equipped with a Kinetex F5 Core–Shell HPLC Column and a precolumn (150 × 2.1 mm, 1.7 μm particle size, Phenomenex, Torrance, CA). Extracts and calibration solutions of the standard mixture, prepared in the concentration range of 1.0–250 ng mL−1 in ACN, were diluted, mixed, and injected using a sandwich injection technique. The injection sequence consisted of 3 μL of distilled water, followed by 1 μL of the sample or calibration solution, 0.5 μL of an internal deuterated standard mixture in ACN, and another 3 μL of distilled water. The final composition of the injected sample or calibration solution was 80% water and 20% ACN. Five deuterated AAs, used as internal standards (ISTD) at a concentration of 50 ng mL−1, were selected to span the retention time range of the target amine mixture. The column temperature was set to 35 °C. The mobile phase consisted of water (A) and ACN/methanol (50/50) (B), both containing 0.1% (v/v) formic acid. The gradient program was as follows: 0 min, 10% B; 0–7 min, increased from 10% to 98% B; 7–10 min, held at 98% B; 10–10.3 min, decreased from 98% to 10% B, followed by a re-equilibration at 10% B until 20 min. The flow rate was maintained at 0.3 mL min−1.
An Agilent 6495A Triple Quadrupole Mass Spectrometer (Agilent Technologies, Santa Clara, CA) with a mass resolution of 0.7 amu (FWHM, autotune) and mass accuracy of 0.1 amu from 5 to 1000 m/z was used to quantify AAs. The ion source parameters were set as follows: gas temperature of 280 °C, gas flow at 15 L min−1, nebulizer pressure at 25 psi, sheath gas temperature at 380 °C, sheath gas flow at 12 L min−1, capillary voltage of 3000 V (positive mode), and nozzle voltage of 300 V. The instrument operated in ESI-positive dynamic multiple reaction monitoring (dMRM) mode. For MS/MS analysis, two transitions were monitored for each analyte. Collision energies for the [M + H]+ precursor ions of both target analytes and ISTDs are provided in Table S4.† Agilent MassHunter Workstation Software, LC/MS Data Acquisition (version B.08.00) for the 6400 Series Triple Quadrupole, was used for dMRM data acquisition, while AA quantification was performed using Agilent MassHunter Quantitative Analysis software, version B.07.01 for QQQ.