Metabolomic Changes in Rice (Oryza sativa L.) Subjected to Herbicide Application through HPLC-HRMS and Chemometrics Approaches
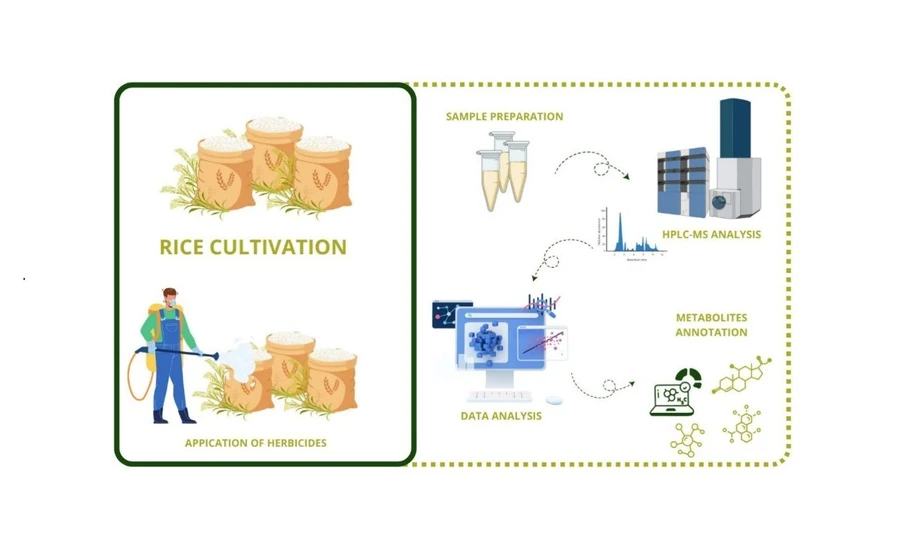
ACS Agric. Sci. Technol. 2025, 5, 8, 1641–1653: Graphical abstract
This study investigated metabolomic changes in rice matrices exposed to the herbicides imazapyr, imazapic, and clomazone using HPLC-HRMS combined with chemometric analysis. PLS-DA successfully differentiated treated samples from controls, and VIP scores highlighted key metabolites responsible for class separation. Putative annotation of significant m/z features further supported the identification of herbicide-related metabolomic alterations.
Herbicide application led to consistent reductions in free sugar levels across all rice matrices and a notable decrease in flavonoid content in the husk. Additionally, the phenylpropanoid biosynthesis pathway was markedly disrupted. Overall, the integration of HPLC-HRMS with multivariate statistical approaches proved highly effective for detecting herbicide-induced metabolic changes, providing valuable insight into chemical stress responses in rice cultivation.
The original article
Metabolomic Changes in Rice (Oryza sativa L.) Subjected to Herbicide Application through HPLC-HRMS and Chemometrics Approaches
Almir Custodio Batista Junior, Jussara Valente Roque, Nerilson Marques Lima, Daniel de Almeida Soares, Mellissa Ananias Soler da Silva, Andréa Rodrigues Chaves*
ACS Agric. Sci. Technol. 2025, 5, 8, 1641–1653
https://doi.org/10.1021/acsagscitech.5c00226
licensed under CC-BY 4.0
Selected sections from the article follow. Formats and hyperlinks were adapted from the original.
Food security is currently a pressing issue in light of an unprecedentedly growing global population. (1,2) In this context, rice (Oryza sativa L.) stands out as an important and nutritious food for at least half of the world’s population. Moreover, rice production plays an important role in the economies of several countries. Due to the demand for the production of this grain, strategies have been implemented to enhance productivity and ensure high yields, which includes the use of chemical agents to control pests and weeds. (1−3)
Hence, it is essential to develop studies on the metabolomic profile of plants exposed to chemical agents. In this regard, untargeted metabolomic assays are an effective tool for deciphering variations arising from specific conditions, such as the exposure of plants to herbicides. (17−19) High-resolution mass spectrometry (HRMS) stands out as an analytical technique widely applied to this aim due to the ability to deliver high information content and accuracy on metabolite identification. (20−22) The chromatographic systems have been integrated into metabolomics methods to address matrix complexity and prevent ion suppression effects in HRMS systems. These strategies are well established in the literature and consistently contribute to the enhancement of reproducibility, sensitivity, specificity and MS resolving power. (20,23)
Among the challenges of metabolomics through HRMS, data processing is impractical without the aid of advanced tools due to the sheer volume of information. Thus, chemometric approaches are invaluable in metabolomics studies, as they provide statistical and machine-learning strategies capable of elucidating variations in the metabolome of the organism under study. (24,25) Therefore, this study aims to evaluate the effects of using imazapyr, imazapic, and clomazone in rice cultivation through high-performance liquid chromatography coupled with HRMS (HPLC-HRMS) and chemometric approaches (Figure 1). Combined, these approaches contribute to revealing the molecular-level impacts of these chemical agents, which are essential in rice cultivation but may pose risks to consumers and alter the nutritional value of globally consumed foods.
2. Materials and Methods
2.3. HPLC-HRMS Analysis
HPLC-HRMS analyses were performed on an LC-20AD system (Shimadzu, Kyoto, Japan) coupled with a microTOF-Q III mass spectrometer (Bruker, Bremen, Germany). Chromatographic separation was achieved using a C18 column (2.1 × 100 mm, 1.8 μm) with a column temperature of 40 °C, a sample injection volume of 3 μL, and a mobile phase flow rate of 0.250 mL min–1 in isocratic elution mode. The mobile phase consisted of methanol and 0.10% (v/v) formic acid in water (80:20). The total chromatography run took 45 min. HRMS analysis was conducted in positive ionization mode using an electrospray ion source, with a capillary voltage of 4 kV, a drying gas flow rate of 8 L.min–1, a nebulizer pressure of 4 bar, and a capillary temperature of 180 °C. Mass spectra were archived ranging from 100 to 1200 m/z and processed using the Data Analysis software version 5.0 (Bruker Daltoniks, Bremen, Germany).
3. Results and Discussion
3.2. Chemometric Analysis of Metabolomic Data
A data matrix used for the analysis consisted of 72 samples and 108,725 m/z features. PCA was performed to explore the overall variance in the data set and assess potential clustering patterns between herbicide-treated and control samples, as well as among the different rice matrices. The first three principal components (PC1, PC2, and PC3) explained approximately 53% of the total variance, indicating a moderate capture of data variability. Figure 3 displays the PCA score plots generated from these components, along with the respective loadings plots.
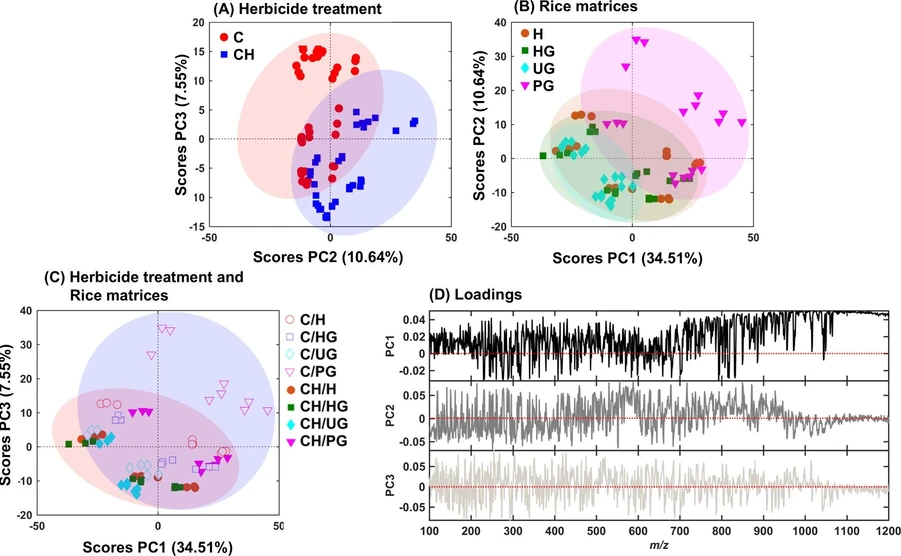 ACS Agric. Sci. Technol. 2025, 5, 8, 1641–1653: Figure 3. PCA scores for herbicide-treated and control rice samples, separated by (A) treatment group (C: Control, CH: Cultivated with Herbicide), (B) rice matrix (H: Husk, HG: Husk and Grain, UG: Unpolished Grain, PG: Polished Grain), and (C) combined treatment and rice matrix groups. Panel (D) shows the loadings plot for PC1, PC2, and PC3, indicating the contribution of each m/z variable to the principal components.
In Figure 3A, samples are grouped based on herbicide treatment (C and CH). A slight separation is observed between the C and CH samples along the combination of PC2 and PC3, suggesting some differentiation in metabolomic profiles between control and treated samples, though the separation is not definitive. Figure 3B shows the grouping by rice matrix (H, HG, UG and PG). In this case, the groups H, HG, and UG are largely overlapping, with no clear separation, while PG (polished grain) shows a slight distinction with positive scores along both PC1 and PC2, indicating a possible loss of nutrients associated with polishing.
In Figure 3C, where samples are grouped by both herbicide treatment and rice matrix (resulting in eight groups), no clear separation is observed among the combined groups. However, there is a trend indicating a slight separation between control and herbicide-treated samples, as observed in Figure 3A, with filled and empty symbols representing treated and control samples, respectively. This tendency suggests that while the PCA captures some degree of variance associated with herbicide treatment, it is not sufficient for complete discrimination among all groups.
The loadings plot (Figure 3D) presents the contributions of individual m/z variables to the first three principal components. Each line corresponds to the loading weights for PC1, PC2, and PC3, respectively, across the m/z range. Although no specific m/z values showed sharp or isolated contributions, the loading profiles illustrate the complex and distributed nature of the variance across features. Overall, the PCA results suggest that the metabolomic differences induced by herbicide treatment or related to rice matrix are subtle and multifactorial, reinforcing the need for a supervised approach such as PLS-DA to improve class separation and interpretation.
VIP scores were calculated to identify the key metabolites contributing to the separation between classes in each PLS-DA model. At this test, VIP scores rank the m/z variables based on their contribution strength to the model’s discrimination, highlighting the most influential features for class distinction. Each VIP score axis is normalized from 0 to 1, allowing the comparison of variable importance across different classes. Figure 5 displays the VIP scores for each model configuration: (A) herbicide treatment (control vs cultivated with herbicide), (B) rice matrices (husk, husk and grain, unpolished grain, polished grain), and (C) the combined model of herbicide treatment and rice matrices (eight classes). Higher VIP scores indicate m/z values that play a more significant role in differentiating the classes within each model, thereby providing insights into the metabolites most affected by herbicide exposure and differences among rice matrices.
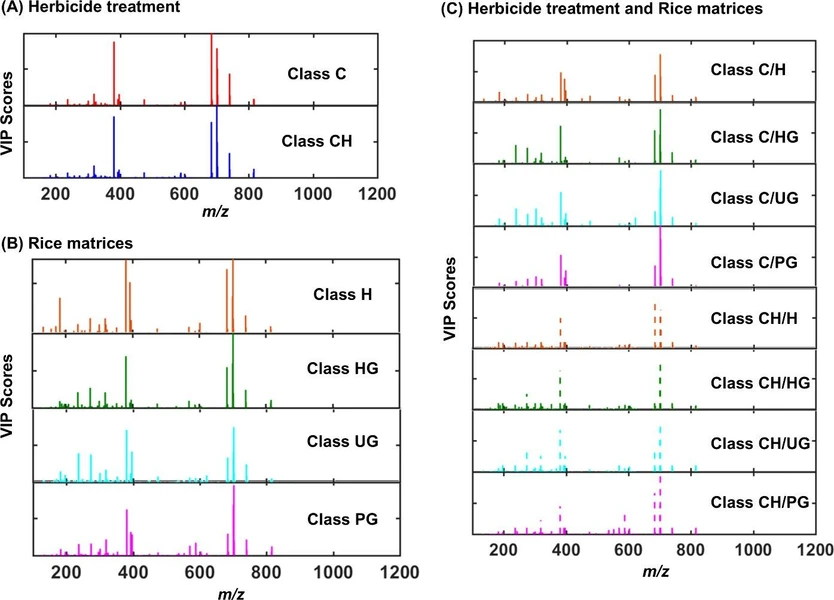 ACS Agric. Sci. Technol. 2025, 5, 8, 1641–1653: Figure 5. VIP score plots from the PLS-DA models, showing the most influential m/z variables for class separation across different configurations: (A) herbicide treatment (C: Control, CH: Cultivated with Herbicide), (B) rice matrices (H: Husk, HG: Husk and Grain, UG: Unpolished Grain, PG: Polished Grain), and (C) combined treatment and rice matrices (C/H, C/HG, C/UG, C/PG, CH/H, CH/HG, CH/UG, CH/PG). The VIP score axes are normalized from 0 to 1 within each model.
In Figure 5A, the PLS-DA model contrasting herbicide-treatment, the m/z values 381, 683, 701, and 739 stand out with the highest VIP scores. These m/z values denote high importance across both classes, being a key contributor to the separation between herbicide-treated and control groups. The fact that these metabolites are prominent in both classes suggests that they may play significant roles in the baseline metabolic composition of rice.
In Figure 5B, which represents the PLS-DA model based on the different rice matrices (H: Husk, HG: Husk and Grain, UG: Unpolished Grain, PG: Polished Grain), the same m/z values observed in the previous model─381, 683, 701 and 739─continue to show high VIP scores, indicating their consistent importance across rice matrices. This reinforces their role as influential metabolites within the rice metabolome, potentially involved in fundamental metabolic pathways that vary with rice component or structural composition.
In addition to these, m/z 393 stands out with a particularly high VIP score in the husk (H) matrix, suggesting its unique significance in this part of the rice grain. The prominence of m/z 393 specifically in the husk may indicate a metabolite that plays a protective or structural role in the outer layer of the rice, potentially involved in defense mechanisms against environmental stressors, such as herbicides. This finding highlights the differentiated metabolic profile of the husk compared to other matrices, suggesting that certain metabolites are more concentrated or have heightened importance in this protective layer.
In Figure 5C, which combines herbicide treatment and rice matrices (resulting in eight classes), the m/z values 381, 683, 701, and 739 still exhibit high VIP scores, underscoring their consistent role in differentiating groups across all configurations. This consistency suggests that these metabolites are central to the rice metabolome, potentially associated with fundamental metabolic pathways affected by both rice matrix and herbicide treatment. The ion at m/z 701 can be associated with phospholipids from the phosphatidic acid class, such as dioleoyl phosphatidic acid. This class of lipids is categorized as membrane lipids and serves as a rich source of signaling molecules in response to various stresses encountered by plants such as rice. (46) Its expression in the CH group was significant for group classification, indicating the stress to which the plant was subjected. Furthermore, putative annotation can relate m/z 381 with the presence of monoacylglycerols. This molecule was detected in the rice husk that may reflect lipid metabolic activity and stress responses, potentially contributing to cuticular properties and defense mechanisms in this protective tissue. (47)
Notably, m/z 393, which showed a high VIP score in the husk (H) matrix in the previous model, now displays a lower VIP score specifically in the herbicide-treated group. This reduction in VIP score for m/z 393 within the treated samples suggests that the presence or abundance of this metabolite may have been suppressed or altered by herbicide exposure. (47) Given its initial importance in the husk, which may serve a protective or defensive role, the decreased VIP score in the treated group might indicate that herbicides impact its synthesis or accumulation. This observation highlights the potential influence of herbicides on specific metabolites associated with environmental response, particularly in the protective layers of the rice grain. The m/z 393 ion may be associated with a phosphatidic acid 16:0. These molecules may be present in rice husk and function as intermediate metabolites in the biosynthesis of storage lipids and recognized as signaling molecules that respond to adverse conditions through their accumulation or depletion. (48)
The VIP scores from the PLS-DA models identified several m/z values as the most informative for class separation, with consistent metabolites appearing as key contributors across different models. However, these m/z values likely belong to central metabolic pathways, as they were important in all classes, regardless of herbicide treatment or rice matrix. This observation suggests that the VIP score analysis did not reveal substantial differences in specific metabolites that could be directly associated with herbicide exposure or its varying effects across rice matrices. To gain a deeper understanding of the metabolomic shifts related to herbicide treatment, a putative annotation was subsequently performed.