Imaging of Protein Assemblies up to 231 kDa in Tissues with Nano-DESI Mass Spectrometry
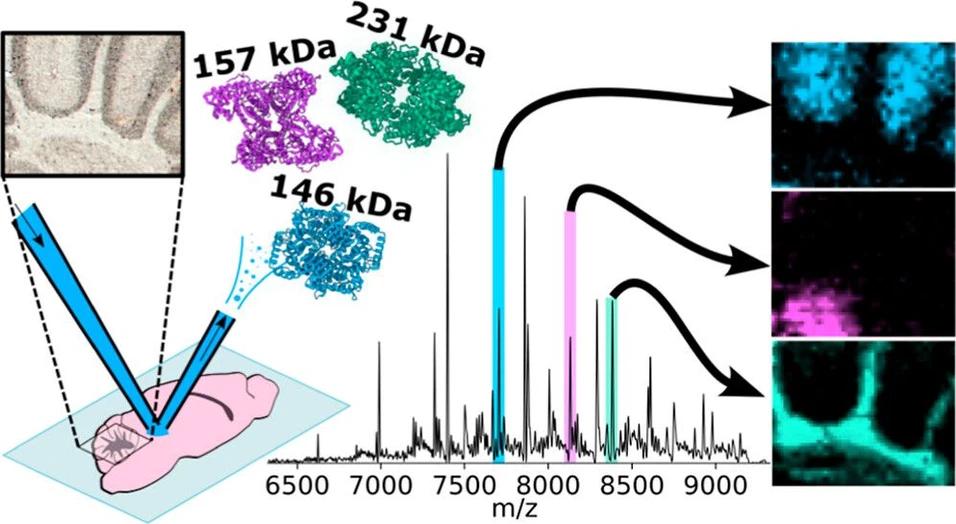
Anal. Chem. 2025, 97, 51, 28343–28352: Graphical abstract
Nano-DESI mass spectrometry imaging (MSI) enables direct detection and identification of intact protein complexes in tissues, but previous applications were limited to assemblies below 113 kDa. This study demonstrates nano-DESI imaging of protein assemblies up to 231 kDa by combining nano-DESI with a mass spectrometer architecture optimized for high molecular weights.
Using mouse brain and rat kidney tissues, both homo- and heteromeric protein assemblies were identified by native top-down MS without complementary surface extraction methods. Complexes were observed with endogenous small-molecule and metal cofactors, expanding nano-DESI’s capabilities for studying large oligomeric protein assemblies. These developments position nano-DESI as a powerful tool for structural biology, molecular pathology, and drug discovery.
The original article
Imaging of Protein Assemblies up to 231 kDa in Tissues with Nano-DESI Mass Spectrometry
Oliver J. Hale, and Helen J. Cooper*
Anal. Chem. 2025, 97, 51, 28343–28352
https://doi.org/10.1021/acs.analchem.5c05767
licensed under CC-BY 4.0
Selected sections from the article follow. Formats and hyperlinks were adapted from the original.
Spatial biology is a rapidly evolving field enabling the understanding of molecular mechanisms that drive physiological processes in tissues. (1,2) Mass spectrometry imaging (MSI) is a spatial omics technique that can map a wide range of biomolecules, such as metabolites, lipids, and intact proteins. Uniquely, MSI can precisely map chemically distinct forms of individual protein species (proteoforms). We have previously shown that nanospray-desorption electrospray ionization (nano-DESI) (3) coupled to MS facilitates MSI of intact, noncovalent protein assemblies and complexes directly from the tissue, providing insight into biological function such as their role in neurodegenerative pathology. (4)
A particular challenge for protein MSI is high molecular weight (MW) analysis. The most established MSI methodology, matrix-assisted laser desorption/ionization MSI, (5) can image denatured proteoforms, but despite a ∼30 year heritage, it remains largely limited to imaging of lower (<30 kDa) MW species. Nano-DESI under denaturing conditions has been used to image proteoforms up to ∼72 kDa (6) when coupled to charge-detection-MS. Nano-DESI under native-like conditions has achieved imaging of protein complexes with MW ∼100 kDa (94 kDa (7) and 113 kDa (8)) with conventional MS. Native nano-DESI MSI is generally hindered by poorer signal intensity and signal-to-noise ratio at higher MW. Mass measurement accuracy may also be poor owing to the presence of broad peaks, attributed to incomplete declustering, even when using a high-performance mass analyzer. (9)
Further challenges exist for the in situ identification of protein assemblies and complexes. To avoid inferring proteoform identity from MW alone, separate offline native top-down mass spectrometry (nTDMS) experiments are required. While nano-DESI MS has been used in some cases, (6,10−12) nTDMS of high MW proteins benefits from offline liquid extraction surface analysis (LESA) MS. (7) A combination of sample complexity, low signal intensity, and instrument hardware optimized for lower m/z analysis has hindered nano-DESI for nTDMS at high m/z. For example, while we have previously reported direct detection of LDHA tetramer from rat liver, poor signal quality precluded imaging the distribution of the assembly. (7)
In this work, we demonstrate nano-DESI MSI for protein assemblies with MW of 125 up to 231 kDa and identify these complexes by nTDMS with the same nano-DESI ion source by harnessing the features of an Orbitrap Ascend Structural Biology mass spectrometer. This mass spectrometer offers high sensitivity m/z detection up to m/z 16000, narrow quadrupole isolation (width = 5 m/z) of precursor ions up to m/z 8000, and multistage ion manipulation (MSn). The results presented constitute a more than 2-fold increase in mass range attainable by nano-DESI MSI.
Methods
Nano-DESI Mass Spectrometry
All MSI and nTDMS experiments were performed with a home-built nanospray-desorption electrospray ionization (nano-DESI) ion source based on a previously published source design and described previously. (13,14) A cartoon of nano-DESI is included in Figure S1. Briefly, the nano-DESI probe is composed of two fused silica capillaries. The first delivers a continuously flowing solvent to the sample surface where it forms a dynamic liquid junction bridging the first capillary, the sample, and the second capillary (emitter). Proteins and other endogenous molecules are dissolved from the tissue into this liquid bridge. The emitter aspirates the solvent and dissolved analytes, which are introduced into the mass spectrometer by electrospray ionization. By scanning the tissue sample underneath the nano-DESI probe, we can correlate protein signal abundance with spatial location and map as ion images. The solvent system was 200 mM aqueous ammonium acetate + 0.125% C8E4 detergent (0.5× critical micelle concentration, CMC), which results in charge-reduced, stabilized noncovalent protein complexes in the gas phase. (15) Empirical observations in our laboratory suggest that adding C8E4 to ammonium acetate solutions improves the nano-DESI liquid junction stability and the extraction of protein complexes from the tissue. At 0.5× CMC, soluble and membrane-associated proteins are dissolved, but transmembrane proteins require concentrations exceeding 1× CMC for extraction. (8,16) The solvent flow rate was typically = 0.6–0.65 μL/min, the probe raster speed was 3–10 μm/s, and the electrospray voltage was tuned to between 800 and 1400 V to achieve electrospray stability with RSD % < 15% (as measured by the tool in Tribrid Tune 4.2) when monitoring the [C8E4+H]+ peak (m/z 307.2) using the linear ion trap (LIT) mass analyzer.
The nano-DESI ion source was attached to an Orbitrap Ascend Structural Biology Tribrid mass spectrometer (Thermo Scientific, San Jose, CA) configured with the native MS, HMRn+, ETD, proton transfer charge reduction (PTCR), and UVPD options, referred to herein as “Orbitrap Ascend”. Specifically, the native MS option includes a low-frequency (∼497 kHz versus the standard ∼1090 kHz) RF power supply for the quadrupole mass filter (QMF) for optimized operation at high m/z. The transmission ion optics operate at ∼1.1 MHz (versus ∼2.4 MHz on the Orbitrap Eclipse mass spectrometer we used previously), and the source prefilter quadrupole is longer to increase collisional cooling of high m/z ions. (17) A combination of in-source CID (=200 V) and the source CID compensation factor (=0.07) was set to achieve a broad filtering effect on the ion beam prior to the QMF, Figure S2, Supporting Information. (18) The Orbitrap Ascend was operated in the “Intact Protein” mode, ion routing multipoles (IRMs) set to the “high pressure” mode (nitrogen bath gas, front-IRM (F-IRM) pressure; 15 mTorr, back-IRM (B-IRM) pressure; 20 mTorr), and LIT helium pressure 2.8 × 10⁻⁵ Torr. The ion transfer tube was set to 275 °C, and the source pressure was in the range 2.3–2.5 Torr. Note that source pressure is dependent on external factors such as the position of the nano-DESI emitter at the inlet and the ambient temperature, so it varies slightly day to day. Experiment-specific instrument settings are described below, in Tables S1–S3 in the Supporting Information, or with presented data, as appropriate. The Orbitrap Ascend was calibrated using the internal “Auto-ready” ion source to deliver FlexMix and run the automatic calibration procedures for positive ion, negative ion, intact protein, and high mass options. Supplemental calibration with AHFP (for ultrahigh mass calibration only) was performed as required using an external electrospray ionization source.
Data Processing
Raw mass spectra were viewed and analyzed in FreeStyle (v1.8.63.0 SP2, Thermo Fisher Scientific). Peak S/N was determined with the in-built tool. For scan mode optimization, Thermo .raw files were first converted to .csv format using the tool in FreeStyle. Then, the intensity data for specified charge states of protein complexes were extracted from the .csv files and plotted with a Matplotlib-based Python script, available at https://github.com/coopergroup-massspec/Q-HCD_voltage_plots.
Brain ion images were processed using the MetaUniDec workflow for protein MSI. (19) In short, ion images in the imzML format were produced with FireFly (v3.2.0.23, Prosolia Inc.) and passed through imzML Converter (20) to fix the file for pyimzML compatibility. The fixed imzML file was imported to MetaUniDec (21) with the imzML import tool (v7.0.0b), and deconvolution was performed on the mass spectrum for each pixel to transform the data from m/z to mass domain. Deconvolution settings are specified in Table S4. The mass domain data was exported to a new imzML file and viewed with MSiReader (v1.02). (22) Mass images were generated with a tolerance of ±50 on the mass reported in Table S5 to allow for variability in per-pixel deconvolution. For generating mass images from multiple proteoform charge states in the kidney, a previously described manual processing workflow for Thermo .raw files was used. (7) Ion images were generated for the m/z at peak apex ±1 m/z. This method was used owing to lower S/N in the kidney mass spectra compared to the brain (Figure S3), which was detrimental to UniDec deconvolution. All ion images are shown with 1 order of linear interpolation.
Intact MWs were determined by deconvolution of nano-DESI MSI spectra and nano-DESI-PTCR MS2 spectra using UniDec. For identification of proteoforms, a combination of Prosight PC, Prosight Lite, and MASH Native was used. (23,24) Fragment ions were assigned within a tolerance of 20 ppm from the calculated MW. Proteoforms identified from the mouse brain and rat kidney are described in Tables S5 and S6 and Supporting Information, respectively. Putative assignments were validated manually.
Results and Discussion
Nano-DESI MSI of High Molecular Weight Protein Complexes
Mouse Brain Cerebellum
Native nano-DESI MS images of the cerebellum of the mouse brain are shown in Figure 2. Four example protein assemblies, which exhibited unique spatial distributions within the structures of the cerebellum, were characterized by nano-DESI nTDMS (see below). That is, it was not necessary to use LESA MS for identification. Homotetrameric PKM1 (Figure 2c, measured MW 231.414 kDa and calculated MW 231.418 kDa) was abundant in the white matter of the arbor vitae. PKM1 is more than double the MW of the previous highest MW protein complex to have been imaged with nano-DESI (aquaporin-0, 113 kDa). (8) Homotetrameric AldoC (Figure 2d, measured MW 157.058 kDa, calculated MW 157.056 kDa) was abundant only in a region of the cerebellar gray matter, likely a deep cerebellar nucleus. Both PKM1 and AldoC are enzymes in the glycolysis pathway and are essential for supporting the high energy demands of cerebellum function. (25,26) Their differential expression indicates that specific enzymatic processes on the pathway are dominant in these regions. Two complexes of lactate dehydrogenase (LDH) were also detected, which are also critical to energy production. (25) A heterotetrameric LDH complex comprising three LDHB subunits and one subunit of glutathionylated LDHA (LDHA1B3) was highly abundant in the molecular layer (Figure 2e, measured MW 146.212 kDa and calculated MW 146.165 kDa). Finally, homotetrameric LDHB (LDHB4) showed the least specific localization of these examples, being broadly distributed throughout the cerebellum with greatest abundance in the white matter (Figure 2f, measured MW 145.926 kDa, calculated MW 145.934 kDa). The two LDH tetramers exhibited very different spatial distributions, suggesting different functions for each modulated by the presence of the LDHA subunit. The subunit composition of LDH tetramers is known to influence enzymatic activity, particularly to bias toward glycolytic or oxidative metabolic pathways and for LDHA and LDHB to be differentially expressed in different brain cell types according to their metabolic requirements. (27) Notably, LDHB favors conversion of lactate to pyruvate, suggesting this is a major process under aerobic conditions in the arbor vitae. (28)
 Anal. Chem. 2025, 97, 51, 28343–28352: Figure 2. MSI of mouse cerebellum. (a) Brightfield optical image of the mouse brain section in the sagittal plane. (b) Annotated zoom of the cerebellum showing the region imaged by nano-DESI MSI. Nano-DESI MS images for protein complexes in the cerebellum; (c) PKM1, 231.4 kDa, homotetramer (charge states 30+-26+); (d) aldolase C, 157.1 kDa, homotetramer (charge states 21+-19+); (e) LDHA1B3 heterotetramer, 146.2 kDa (charge states 21+-19+); and (f) LDHB, 145.9 kDa (charge states 21+-18+), homotetramer. Annotations: Mo: molecular layer, Gr: granular layer, Arb: arbor vitae white matter, and DCN: deep cerebellar nuclei. MSI pixel size: 46 × 50 μm. Scale bar (a) and 500 μm, (b–f) 100 μm. Mass image tolerance = deconvoluted MW ± 25 Da.
Identification of Brain and Kidney Complexes by Nano-DESI nTDMS
Each protein complex in the mouse brain cerebellum and rat kidney was characterized by nano-DESI nTDMS (Figures 4 and 5, respectively). PTCR MS2 was used to validate the intact molecular weights calculated from MSI data (Table S5 and Table S6, Supporting Information). HCD MS2 was used to obtain sequence fragments for proteoform identification.
 Anal. Chem. 2025, 97, 51, 28343–28352: Figure 4. Nano-DESI MS2 spectra of protein complexes from brain images. (a) PTCR MS2 of PKM1 (m/z 798229+ ± 10, 2 ms), (b) HCD MS2 of PKM1 (m/z 747631+ ± 2.5, 138 V), (c) PTCR MS2 of AldoC (m/z 7479.621+ ± 2.5, 35 ms), (d) HCD MS2 of AldoC (m/z 748121+ ± 2.5, 142 V), (e) PTCR MS2 LDHA1B3 (m/z 730920+ ± 2.5, 35 ms), (f) HCD MS2 of LDHA1B3 (m/z 731020+ ± 2.5, 135 V), (g) PTCR MS2 of LDHB4 (m/z 729720+ ± 5, 40 ms), and (h) HCD MS2 of LDHB4 (m/z 729720+ ± 2.5, 135 V). Deconvolution result for each PTCR MS2 spectrum shown as an inset. PTCR reaction time (ms) and HCD voltage (V) for each experiment are in brackets.
Conclusions
We have demonstrated native MS imaging and native TDMS with nano-DESI for protein complexes in mouse and rat tissues spanning the MW range 125–231 kDa. The MW range possible with nano-DESI MSI is now more than double the previous highest MW, strengthening its position as a tool for in situ structural biology. There now exists an overlap between the higher MWs accessible with native nano-DESI MSI and the lower MWs accessible with cryo-electron tomography pointing to future studies that could combine these two technologies. (46)
A key advance reported here is the identification of the protein assemblies solely by use of nano-DESI. Previously, we have relied on LESA MS for protein identification as an adjunct to nano-DESI for visualization of protein distribution. It is also important to note that, while to date the protein assemblies detected and identified by native ambient mass spectrometry have predominantly been homomeric, we identified heteromeric assemblies in this work.
Despite the improvements realized here, requiring collisional activation of protein complexes for improving signal quality is counterintuitive when one of the goals of native MS is to retain noncovalent interactions, which may be disrupted. Although we have detected complexes intact with their endogenous cofactors with native stoichiometries, there will likely be more delicate complexes that will not tolerate activation. We will explore alternative methods for boosting the signal intensity in future work. Nano-DESI MSI has already revealed new information on lower MW (∼30 kDa) protein complexes in a neurodegenerative proteinopathy. (4) With a much higher MW range now accessible, imaging and identification of pathological protein candidates, such as early stage oligomers, throughout various tissue types will be possible.