Determination of Copolymer Block-Length Distributions Using Fragmentation Data Obtained from Tandem Mass Spectrometry
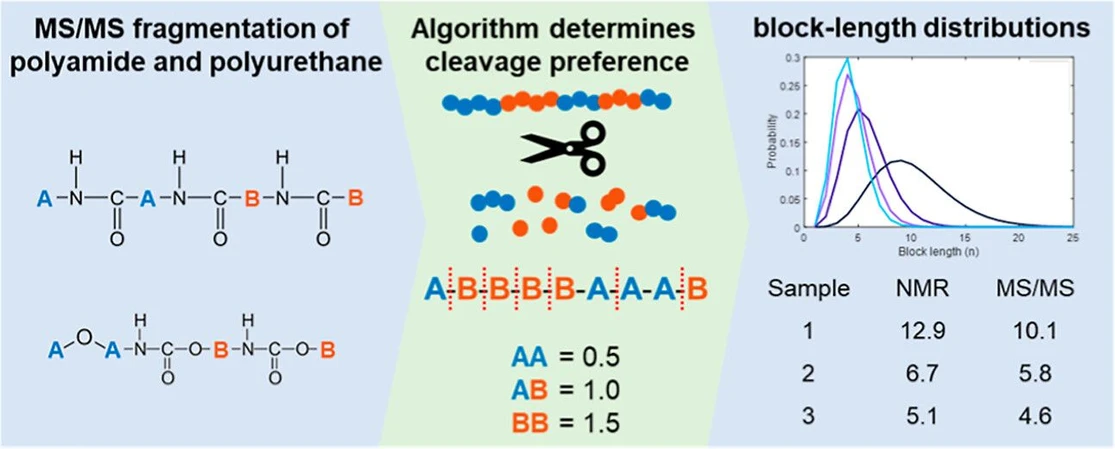
Macromolecules 2025, 58, 13, 6430–6439: Graphical abstract
This work demonstrates the determination of copolymer block-length distributions (BLDs) in polyamides and polyurethanes using tandem mass spectrometry. A dedicated algorithm was developed and refined to extract BLDs from MS/MS fragmentation data, incorporating bond fragmentation preferences to improve accuracy.
Validation with model systems showed strong agreement between MS/MS-derived BLDs and average block lengths obtained by ¹³C NMR. The method enables detailed characterization of copolymer architectures and reveals synthesis-dependent trends, providing deeper insight into structure–property relationships beyond overall composition.
The original article
Determination of Copolymer Block-Length Distributions Using Fragmentation Data Obtained from Tandem Mass Spectrometry
Tijmen S. Bos*, Rick S. van den Hurk, Ynze Mengerink, Ton Brooijmans, Ron A. H. Peters, Arian C. van Asten, and Bob W. J. Pirok
Macromolecules 2025, 58, 13, 6430–6439
https://doi.org/10.1021/acs.macromol.5c00297
licensed under CC-BY 4.0
Selected sections from the article follow. Formats and hyperlinks were adapted from the original.
Synthetic polymers are utilized in a large number of products used for different applications such as clothing, cars, solar panels, housing, drug-delivery systems, and biodegradable implants. (1−5) For most applications, copolymers are used that comprise of multiple different repeating units, also referred to as monomers. The potential application of copolymers seems to be unlimited when it comes to designing tailor-made physical, mechanical, and structural properties. The properties of a copolymer depend heavily on the sequence, type, and number of different monomers as they determine the intramolecular interactions. In general, copolymers are heterogeneous and their chemical (or molecular) structure cannot be described by singular values, but rather by distributions. (6) These chemical distributions include but are not limited to, the molecular-weight distribution (MWD), chemical-composition distribution (CCD), branching distribution (BD), functionality-type distribution (FTD), branching distribution (BD), and block-length distribution (BLD). (1,7) The molecular structure encompassing these distributions directly translates into its macroscopic properties. (8) To establish structure–property relationships it is essential to accurately characterize the molecular structure of copolymers, including the BLD.
The BLD is of high interest to the design of advanced materials with specific properties. Block structures within copolymers can be used to create and control so-called microphase-separated structures. (9,10) For instance, block copolymers can be produced with a constant average chemical composition (e.g., 50% monomer A and 50% monomer B) but with different average block lengths and BLDs. Noro et al. demonstrated that for a relatively simple diblock and triblock structure, the microdomain spacing increased with increasing BLD width (dispersity of a block type) at constant chemical composition. (9) They furthermore demonstrated that triblock copolymers arrange into regular microphase-separated structures more easily than diblock copolymers which directly impacted the macroscopic properties. The role of the BLD in the formation of solid-state structures has also been investigated for polypeptide-styrene copolymers. (11) The resulting morphology was a plane lamellar structure that was disrupted according to the length of the helices, indicating the influence of the BLD on the interface curvature properties. Another example of macroscopic properties determined by the block structure is in self-assembling methacrylic acid (MAA) and methyl methacrylate (MMA) copolymers. The shape of the copolymer in solution was dependent on the polyMAA and polyMMA block lengths. (8) Block copolymers are also used for nanoparticle-based drug-delivery systems where the BLDs influence the radius of the self-assembling micelles in solution. (12) In the case of thermoplastic polyurethanes (TPU), these microphases are built up from the soft and hard blocks in the polymeric chains. The hard segments may create locally crystalline structures by coordinating with other hard blocks of either the same or different polymer chains, thereby contributing to the strength, rigidity, and melting point of the material. The soft segments are typically polymeric diols which give a flexible amorphous structure that influences the elasticity and flexibility and selective migration of small molecules through the soft domains. The average and dispersity of these BLDs impact the thermal and mechanical properties of TPU. (13−18) For example, a higher Young’s modulus with increasing hard-block lengths has been demonstrated as well as differences in water vapor permeability. (19,20) With regard to the dispersity of the distribution, it has been demonstrated that narrow distributions exhibit a higher modulus and thermal resistance. (18,21,22)
To acquire information on the block length of copolymers, the polymer must be reduced to smaller, detectable fragments. This can be achieved through sample transformation. (6) For synthetic polymers, this can be accomplished by using pyrolysis gas chromatography (py-GC) coupled with mass spectrometry (MS). (23,24) By performing pyrolysis, small oligomers are obtained (mostly monomers, dimers, and trimers). Through quantification of the trimers, the blockiness of the polymer can be estimated. The fragmentation process in pyrolysis is random and models have been developed to correct for this effect. (25) However, the length of detectable fragments using py-GC-MS is limited, and longer fragments provide more detailed information about the sequence than shorter ones. Consequently, only the average block length can be determined. More recently, MS-based fragmentation has also been explored to elucidate the sequence of copolymers. This approach has predominantly been applied to copolymers with low molar masses (typically <5000 Da), using liquid chromatography (LC) coupled to tandem MS (MS/MS) or matrix-assisted laser desorption ionization (MALDI)-MS/MS. (26−29) In such cases, the experimental design aims to limit the number of different molecular species introduced into the mass spectrometer simultaneously, thereby producing clean, interpretable spectra. Additionally, the use of low molecular weight species allows for the isolation of singly charged precursor ions, enabling selective fragmentation and analysis at the tandem mass spectrometry level. However, for copolymers with higher molar masses (number-average molar mass > 20,000 Da), the detection of singly charged ions becomes impractical. As a result, the full envelope of multiply charged ions is typically subjected to fragmentation in a nonselective manner, as demonstrated by Mengerink et al. (30) The authors, demonstrated MS-based fragmentation of polyamide copolymers and detecting fragments up to the length of 10 repeating units. (30) For the first time, the BLD could be determined from these fragments using a Monte Carlo (MC)-based algorithm. Algorithms that can transform quantitative copolymer fragment data into BLDs are referred to as SWAMP (Systematic workflow for analyzing multifragmented polymers). To verify these fragmentation methods and develop functional models, reference data was obtained from 13C nuclear magnetic resonance (NMR). In previous work, we recently introduced a machine learning-based algorithm that can more accurately reconstruct the block-length distribution from fragment data. (31) Rather than analytical reference data, simulated ground-truth fragment data was used to develop, optimize, and efficiently test this algorithm to perform SWAMP. However, an actual polymer sample cannot be characterized in silico, some form of quantitative instrumental data is required to apply the new algorithm in a meaningful manner in practice.
This study focuses on elucidating the BLDs of copolymers using MS-based fragmentation data, that is interpreted by a machine learning-based algorithm to derive accurate distributions. The proposed SWAMP workflow was validated using experimental data of two types of copolymers: polyamides and polyurethanes. While polyamide contains polyamide-4,6 and polyamide-4,10, polyurethane is made from (poly)-diols and diisocyanate. The polyamide copolymer was utilized to validate the capability of processing quantitative data into the expected BLDs. The polyurethane copolymers were expected to have a larger difference in fragmentation and ionization. The previously published analytical solution was extended to incorporate cleavage preferences. To assess the ability of the proposed methodology to arrive at meaningful BLDs, five polyurethanes were synthesized, all sharing the same overall chemical composition and comparable molecular weight but with varying block length distributions due to different synthesis routes. The polyamide fragment data was obtained from earlier published work from Mengerink et al. (30) These polyamide samples have the same overall composition but differ due to transamidation in time. The number-average block lengths (NABL) and overall chemical composition of these products were determined with NMR spectroscopy. To prevent interference from small oligomers when introducing samples into the MS, LC (liquid chromatography)-MS/MS was employed.
2. Materials and Methods
2.2.2. NMR Measurements
The NMR instrument used in this study was a Bruker Avance III 500 MHz spectrometer (Bruker Biospin GmbH, Germany) equipped with a 5 mm cryogenically cooled probe head. The sample solutions were prepared by dissolving approximately 15 mg sample in 600 μL tetrachloroethane-D2 (C2D2Cl4) at 100 °C for 13C NMR or by dissolving in DMSO–D6 at 45 °C for 1H NMR. The carbon-13 NMR spectra were processed using a line-broadening factor of 0.1 to enhance the signal-to-noise ratio while minimizing distortion of the peak shapes. The blockiness of the polymer sample was determined with 13C-wheare as the monomer composition was established with 1H NMR.
The NABLs were determined from the 13C NMR spectra using the equations reported by de Ilarduya et al. (32) The spectra were deconvoluted by fitting four Lorentz distributions to the relevant aromatic regions (136.349, 136.363, 136.467, and 136.488 ppm) using a Nonlinear least-squares solver through the use of the Matlab function “lsqnonlin”.
2.2.3. LC–MS/MS Measurements
The LC–MS/MS experiments were performed using an Agilent 1290 Infinity II system comprising of a quaternary pump (G7104A), sampler (G7129B), column oven (G7130A), and a diode-array detector (DAD) (G7117A) equipped with an Agilent Max-Light cartridge cell (G4212-60008, 10 mm, Vdet = 1.0 μL). This LC system was coupled to an Agilent Q-TOF (G6550A) mass spectrometer to perform the MS/MS measurements. The flow from the LC was first directed to the DAD which was then directly coupled to the ESI (electrospray ionization) source of the MS instrument.
A Waters Acuity UPLC BEH C18 (100 × 2.1 mm, 1.7 μm) column was used and operated at a column temperature of 50 °C. Mobile phase A consisted of water with 0.1% (v/v) FA and mobile phase B consisted of unstabilized THF with 0.1% (v/v) FA. The flow rate was set to 0.2 mL min–1 starting at 20% B. A linear gradient to 95% B was performed from 0 to 35 min. It was then held at 95% B for 5 min after which it returned to 20% B in 1 min as starting condition. UV absorption was monitored at 254 nm using a bandwidth of 4 nm at a frequency of 5 Hz. The ESI source was operated in positive ion mode and collision-induced dissociation (CID) was performed with varying voltages (0–40 V) for fragmentation of the copolymers. No ion selection was applied in the first quadrupole. All incoming ions were subjected to CID, and the resulting MS2 spectra were used for interpretation. For a detailed overview of the instrumental settings of the MS, see Supporting Information Section S-1. All MS spectra were recorded in profile mode. The samples were prepared by dissolving the polymer samples in DMF at a concentration of 2 mg mL–1, subsequently, 1 μL of the polymer solution was injected into the LC–MS/MS system. For methods used for the analysis of the polyamides see Mengerink et al. (30)
3. Results and Discussion
3.2. Block-Length Determination on Polyurethane Polymers
3.2.1. Measuring Polyurethane Fragments with LC–MS/MS
Polymeric products can often contain low molecular weight oligomers or cyclic oligomers as impurities arising from the production process. To mitigate interference from these side products and to enable the study of the BLD of the high-molecular-weight polymer, a conventional RPLC method was employed for the separation of these low molecular-weight components from the copolymeric product. Additional details on the separation of oligomers and the copolymeric product can be found in the Supporting Information, Section S-3.
To facilitate MS/MS fragmentation of the polyurethane, it was imperative to ensure that the polymer acquired sufficient charges during the ionization process, ensuring that enough of the resulting fragments remained charged post-fragmentation. To achieve this, formic acid was added to the mobile phase. We assume that when large copolymers have a similar composition, there are no significant differences in ionization, and only fragmentation effects need to be considered. Evaluation of various CID voltages was undertaken to optimize the sensitivity of the generated fragments. It was crucial to ensure sufficient fragmentation to obtain fragments within the observable m/z range. However, the CID voltage should not be too high as this would predominantly result in monomer generation rather than fragments of more substantial lengths. Since our main interest was the MDI-BDO distribution, ideal conditions should favor the formation of these fragments. To investigate the effect of CID voltage on polymer fragmentation, model polymers were used. Particularly, a pure pTHF sample was used to model the ether-bond fragmentation and an MDI-BDO alternating sample was used to study the urethane bonds. Figure 7 shows a selection of fragment ions resulting from the fragmentation of pTHF (n = 10) and an MDI-BDO (n = 6) species while varying the CID voltage from 0 to 40 V. These were chosen as computing fragments longer than 10 monomers is too computationally expensive and for MDI-BDO no fragments longer than 6 monomers were detected. For each bond type, the original and multiple-charged species along with the monomer, and dimer fragments were investigated. In both cases, at 0 V there was some 2+ charge state visible which decreased with increasing CID voltage. Correspondingly, the monomer fragment abundance increased with voltage in both cases. The formation (and later fragmentation) of the dimer-fragment abundance was observed with a tipping point at 25 V for MDI-BDO and around 20 V for pTHF. After this tipping point of pTHF, the most abundant species shifted toward the monomers, which was not ideal for obtaining larger fragments. As shown in our previous work, it is important to have fragments containing at least 4 monomers for an accurate elucidation of the BLDs. (31) Since the detection of fragments containing MDI-BDO was the most challenging the voltage of 25 V was selected as this voltage showed the most abundance. It is important to recognize that this critical parameter should be evaluated for each polymer type and instrumentation setup individually. Direct comparison across different instruments and polymer systems is likely to be challenging due to inherent variability. While the ionization and fragmentation behavior of these oligomers cannot necessarily be extrapolated to the high molecular weight copolymers, a balance between sufficient fragmentation and not fully fragmenting to monomeric species for the copolymer samples was achieved (Figure S-2).
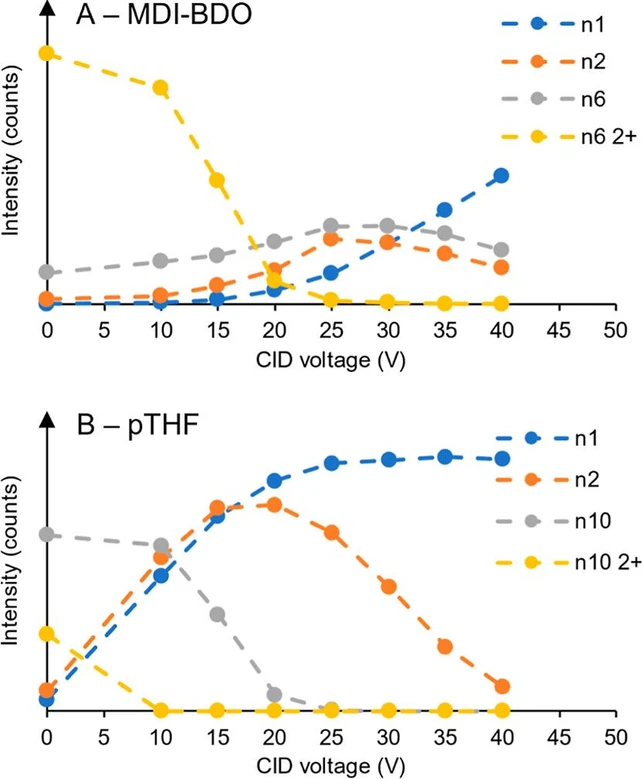 Macromolecules 2025, 58, 13, 6430–6439: Figure 7. Fragment-ion intensity at varying CID voltages for a selection of fragments of pTHF and MDI-BDO representing the ether and urethane bond types, respectively. Data was obtained by LC–MS/MS, for MDI-BDO (n = 6) (A) and pTHF (n = 10) (B).
3.2.3. Block-Length Distributions of Polyurethanes
The definition of the polyurethane copolymer allows the algorithm to ascertain the BLDs of interest. Five polyurethane samples were selected, each expected to exhibit distinct hard-block and soft-block distributions while maintaining identical pTHF distributions, as sourced from the same chemical batch. Each sample exhibits a distinct BLD for the hard block segment MDI-BDO, as shown in Figure 8. Figure 8A displays for the OS sample both the pTHF and MDI-BDO BLD, whereas Figure 8B exclusively displays the BLD of MDI-BDO in the hard block of the TS sample series and the pTHF distribution defined by the algorithm, omitting the representation of MDI-THF in the soft block. Notably, the TS samples demonstrate a decreasing trend in the NABL with an increasing NCO/OH ratio in the initial reaction step, a pattern consistently reflected in the determined BLDs. Specifically, the OS sample, synthesized in a single step and thus more random, exhibits a NABL of 5.0, a value within the NABL range for TS2 and TS3.
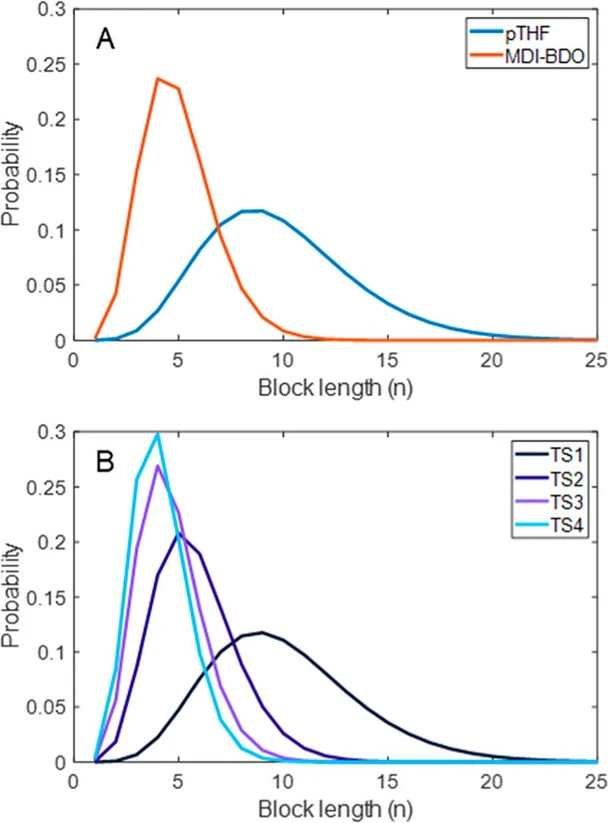 Macromolecules 2025, 58, 13, 6430–6439: Figure 8. Number-based BLDs of pTHF and hard-block MDI-BDO of the OS sample (A) and the MDI-BDO distributions of the TS samples (B).
In the absence of a standard with a known BLD, an alternative method to assess the quality of BLD determination involves comparing the NABLs obtained from nuclear magnetic resonance (NMR) spectroscopy with those derived from the ML algorithm based on tandem mass spectrometry (MS/MS) results. The NABL of the hard and soft block segment was determined through NMR spectroscopy, however the pTHF segment according manufacturer specifications indicates a number-average molecular weight of 1000 Da, corresponding to a NABL of 13.63 while the NMR shows 9.9 ± 3.3.
4. Conclusions
In this study, BLDs were successfully determined from MS/MS data for a series of polyamide samples and five TPU samples, which a of yet not possible with alternative techniques such as NMR. To accommodate the diverse nature of copolymers, the previously developed algorithm (31) was enhanced by incorporating preferences in bond cleavage based on bond type. Additionally, the workflow was adapted to accommodate various copolymer distributions by employing the Schulz-Zimm distribution, capable of processing distributions ranging from Flory to Gaussian. As validation, the polyamide BLDs showed good alignment from those obtained with the MC-based algorithm. By using five TPU samples with the same composition and pTHF segments, the hard block BLDs could be determined without any input such as the composition or fragmentation preference besides the fragment table. Validation of the BLD determination was conducted by comparing the NABL obtained from NMR spectroscopy with the values derived from our workflow. The difference between the NMR-based NABL and our workflow was on average 12% and a maximum of 22%, demonstrating consistency in the trend of hard-block lengths among the different TPU samples. This comparison serves as the current best option for validation, given the absence of standards with known BLDs and the absence of alternative methods to estimate the BLDs. In addition to the strong alignment of the new ML approach with the NMR NABL values, the determination of the BLD provides more detailed information on the chemistry of the TPU.
The determined BLDs were obtained under the assumption that these distributions are consistent across the molecular weight range. However, if this assumption does not hold, a bias may be introduced, as lower molecular weight species generally exhibit higher ionization efficiencies and may therefore be overrepresented in the fragment data. A limitation of the proposed method is the requirement for prior knowledge of the expected distribution type. Although the Schulz-Zimm distribution accommodates a wide range of profiles, it may not adequately describe systems with specifically engineered architectures or multimodal BLDs. In future work, it would be valuable to implement an approach in which each block length is treated as an independent variable, allowing for a distribution-free fitting process. However, this would introduce significant computational demands and substantially increase the uncertainty of the fit given the need to estimate the abundance of each block length, in our case 40 parameters, compared to the six used in the current approach. Addressing this complexity remains a key challenge for further development.