Pilot study of screening method for pancreatic cancer using lipidomic profiling of plasma or serum
Commun Med 6, 127 (2026): Fig. 2: Comparison of lipid profiles obtained by UHPSFC/MS for following group pairs: females vs. males (plasma model), serum vs. plasma (female models), and PDAC patients vs. healthy controls (male models).
Pancreatic cancer remains difficult to detect early, contributing to its poor prognosis. This pilot study evaluates lipidomic profiling of plasma and serum samples as a noninvasive screening approach using ultrahigh-performance supercritical fluid chromatography–mass spectrometry combined with multivariate statistical modeling.
Analysis of samples from patients with pancreatic ductal adenocarcinoma, healthy controls, and high-risk individuals showed diagnostic accuracy exceeding 95%. The lipidomic test detected early-stage cases and outperformed the conventional biomarker CA 19-9, while maintaining high specificity in high-risk populations. These results highlight the potential of lipidomic blood tests for early pancreatic cancer detection and support further clinical validation.
The original article
Pilot study of screening method for pancreatic cancer using lipidomic profiling of plasma or serum
Ondřej Peterka, Robert Jirásko, Zuzana Dolečková, Mária Dosoudilová, Josef Bártl, Jakub Idkowiak, Ondřej Slavíček, Karolína Pešková, Milan Vošmik, Beatrice Mohelníková-Duchoňová, Irena Kozubíková, Martin Loveček, Ondřej Urban, Jan Trna, Petr Karásek, Bohuslav Melichar & Michal Holčapek
Commun Med 6, 127 (2026)
https://doi.org/10.1038/s43856-026-01445-5
licensed under CC-BY 4.0
Selected sections from the article follow. Formats and hyperlinks were adapted from the original.
Pancreatic cancer is among the deadliest malignancies, with a 5-year relative survival rate of only 13% (metastatic 3%, regional 17%, localized 42%, and unspecified 11%)1. The most common subtype is pancreatic ductal adenocarcinoma (PDAC), accounting more than 90% of all pancreatic malignancies2. The incidence and mortality caused by pancreatic cancer have been gradually rising, and it is predicted that pancreatic cancer will become the second leading cause of cancer-related deaths by 2030 and double the number of new cases in the United States3. The combination of chemotherapy and surgical techniques is the primary treatment options for PDAC, but fewer than 20% of patients are diagnosed at a resectable stage because PDAC is mostly asymptomatic or presents with vague symptoms, leading to detection at late-stage4,5. Imaging modalities, such as endoscopic ultrasonography (EUS), magnetic resonance imaging (MRI), and computed tomography (CT), are the standard diagnostic tools for early diagnosis of PDAC6. However, these methods are time-consuming, technically demanding, and often uncomfortable or invasive for patients, which may expose individuals to radiation or contrast agents and can be contraindicated in subjects with certain medical devices, claustrophobia, or allergies7. The carbohydrate antigen (CA) 19-9 is the only biomarker routinely used in PDAC diagnostics, but it has low sensitivity for early-stage disease and lacks specificity, limiting its utility in screening programs8,9. Similarly, despite considerable research into genomics, transcriptomics, proteomics6,10,11,12, and their integration into multi-biomarker panels13,14,15, no worldwide clinically validated biomarkers for early detection of pancreatic cancer have yet emerged14. However, a new blood test, PancreaSure (Immunovia), has been launched commercially in the US in 202516. Lipidomics, a rapidly evolving field focused on the comprehensive analysis of lipids, offers a promising new avenue for biomarker discovery17. Lipids play essential roles in cellular processes, and alterations in lipid profiles have been observed in various cancers, including pancreatic cancer18.
Prospective studies that involve long-term surveillance of high-risk individuals (HRI) have demonstrated improved detection rates of resectable disease leading to median overall survival of 9.8 years compared to 1.5 years for patients diagnosed with PDAC outside surveillance19,20. Although population-wide screening is not feasible, mainly due to cost and logistic limitations, targeted HRI screening is recommended21. In the general population, the lifetime risk of developing PDAC is approximately 1.5%22. However, conventional risk factors such as diet, obesity, alcohol consumption and smoking increase this risk23,24. Additionally, individuals with genetic susceptibility syndromes, a familial pancreatic cancer, or hereditary pancreatitis exceed the risk threshold commonly used to define HRI22,25. An additional potential target group for screening comprises individuals over 50 years of age newly diagnosed with type 2 diabetes mellitus, particularly type 3c. Approximately 1% of these individuals are diagnosed with pancreatic cancer within three years26,27, although this group is not yet officially recognized as high-risk22. Despite recent advances in surgical and medical management, early detection remains the key limitation in improving PDAC prognosis28. A noninvasive, high-throughput method capable of detecting reliable biomarkers in body fluids could be a breakthrough in the early diagnosis of PDAC.
This study builds on our previous work29 that demonstrates the potential of lipidomic profiling to distinguish between healthy controls and PDAC patients with high sensitivity and specificity. In Phase 1, we refine the methodology and address the questions that arise from the earlier studies. In Phase 2, we apply the method to samples from HRI and compare the results with imaging data. The lipidomic profiling method shows high sensitivity and specificity, including for early-stage PDAC, and significantly outperforms carbohydrate antigen 19-9 (CA 19-9) and carcinoembryonic antigen (CEA) in diagnostic accuracy.
Methods
Lipidomic analysis
Two validated and high‑throughput lipidomic quantitative methods using mass spectrometry, with and without the chromatographic separation, were used. The UHPSFC was connected to a Xevo G2-XS QTOF mass spectrometer (Waters, Milford, MA, USA) for high-resolution MS data acquisition. The UHPSFC/MS method30 using lipid class separation approach was used for target lipidomic analysis under the following conditions: Viridis BEH column (100 × 3 mm, 1.7 μm, Waters), flow rate 1.9 mL/min, injection volume 1 μL, column temperature 60 °C, and the automatic backpressure regulator at 1800 psi. Mobile phase A was carbon dioxide and mobile phase B (modifier) was methanol containing 30 mM ammonium acetate and 1% of water. Gradient elution with total run time 8.0 min was set: 0 min—1% modifier; 1.5 min—16% modifier; 4 min—51% modifier; 7 min —51% modifier; 7.51 min, 1% modifier. Makeup solvent with the same composition as modifier with the flow rate 0.25 mL/min was used. The mass spectrometer was equipped with an electrospray ionization (ESI) source and all data were acquired in the positive ion mode.
The FIA-MS/MS method31 was employed for lipidomic profiling without the chromatographic separation, using specific precursor ion and neutral loss scans. The 6500 + QTRAP (quadrupole-linear ion trap, Sciex) mass spectrometer equipped with the Turbo V source was used for data acquisition. In FIA-MS/MS method31, sample introduction was performed using a Shimadzu Nexera LC system, with a mixture of CHCl3/MeOH/IPA (1:2:4, v/v/v) as the pump solution. The flow rate was set to 50 µL/min between 0 and 0.55 min (for sample introduction into the MS source), 5 µL/min between 0.55 and 2.6 min (for MS/MS scan acquisition), and 300 µL/min between 2.6 and 4 min (for system washing). Between injections, the needle was rinsed thoroughly with 1000 µL of the CHCl3/MeOH/IPA (1:2:4, v/v/v) mixture containing 0.5% water. All samples were analyzed in positive ion mode using electrospray ionization.
Results
Effect of gender and matrix on the lipidome
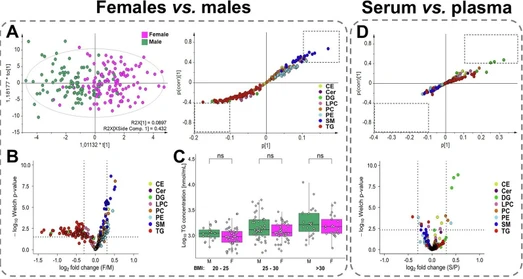
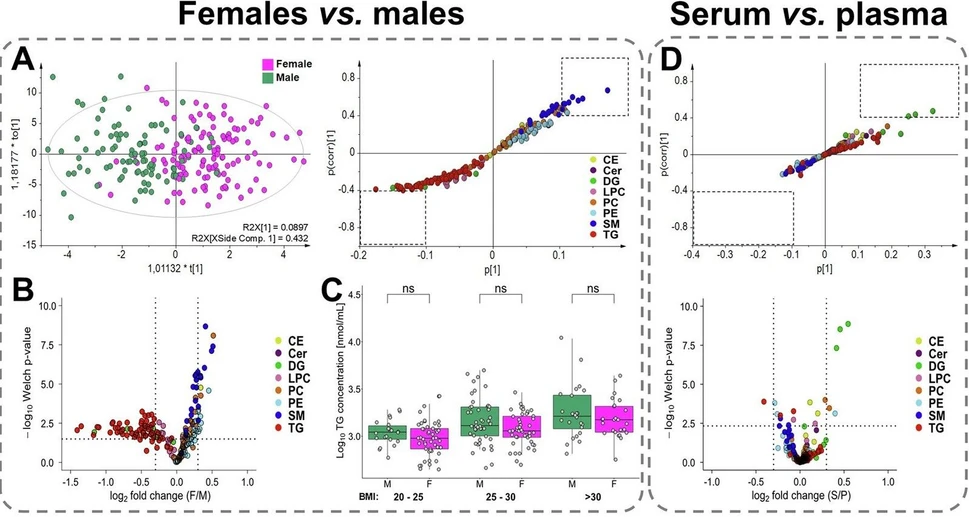
Healthy control samples were used to compare gender-based lipid profiles in plasma (Fig. 2A–C) and serum (Fig. S2A–C). 93 males and 125 females with comparable age and body mass index (BMI) were included in the analysis (Table S2). The concentrations of 190 lipid species from 11 lipid subclasses were compared using univariate statistical methods (Supplementary Data 5) and multivariate data analysis (Figs. 2A and S2A). The supervised OPLS-DA revealed a clear separation between male and female lipidomes. The S-plot generated from OPLS-DA highlights the most dysregulated lipid species (Fig. 2A), which is further supported by volcano plots (Fig. 2B) that illustrate differences based on both p-values and fold change. Statistically significant higher concentrations were observed for nearly all sphingomyelins (SM) and plasmenyl/ether (P-/O-) phosphatidylcholines (PC) with shorter fatty acyl chains (C32–C34) in females. On the contrary, higher concentrations of triacylglycerols (TG) and diacylglycerols (DG) with shorter acyl chains (C32–C34) were identified in males. Slightly higher, though not statistically significant, concentrations were found for PE and PE P-/O- in women, and for LPC in men. Concentrations for other lipid classes, cholesteryl esters (CE), ceramides (Cer), and phosphatidylcholines (PC), were comparable between genders. Although several individual lipid species showed dysregulation within specific classes, no consistent pattern was observed with respect to the fatty acyl chain lengths or the degree of (un)saturation. Independent data evaluation confirmed the same trends for both plasma and serum matrices. Since the male group showed a slightly higher average BMI, the relationship between total TG concentrations and BMI was examined (Fig. 2C). However, statistical analysis did not confirm a significant difference and elevated TG levels in men reflect metabolic differences rather than BMI. However, higher TG levels were correlated with elevated BMI in both sexes, indicating that TG is not an optimal biomarker due to the high variability influenced by lifestyle factors.
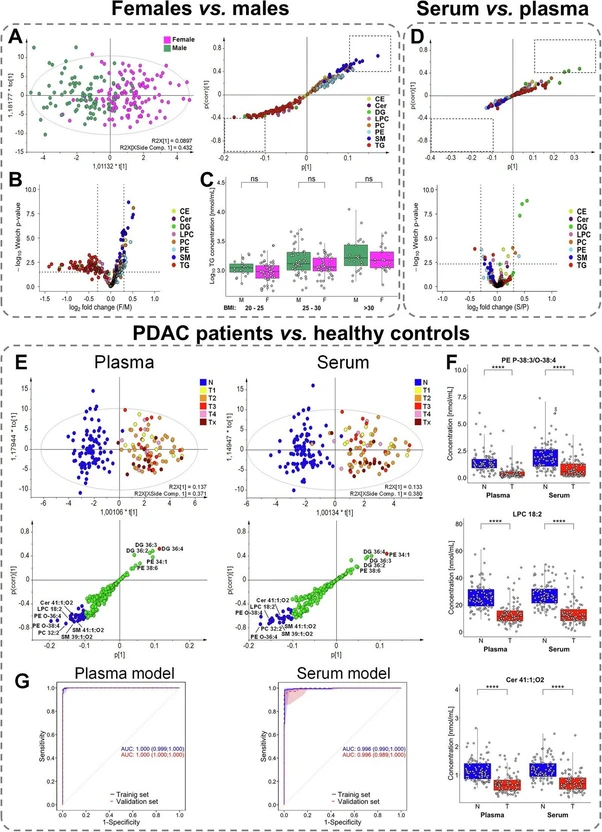 Commun Med 6, 127 (2026): Fig. 2: Comparison of lipid profiles obtained by UHPSFC/MS for following group pairs: females vs. males (plasma model), serum vs. plasma (female models), and PDAC patients vs. healthy controls (male models). A Score plots of orthogonal partial least squares discriminant analysis (OPLS-DA) and the corresponding S-plots highlighting the most dysregulated lipid species. B Volcano plot showing the most dysregulated lipid species based on log2-transformed fold changes and −log10 p-values (two-sided t-test). C Relation between body mass index (BMI) and the sum of triacylglycerols (TG), where significance is determined by the Mann–Whitney U test; p-values > 0.05 correspond to non-significant (ns). BMI categories: 20–25 (22 males and 49 females), 25–30 (47 males and 46 females), and >30 (24 males and 25 females). D Visualization of differences between serum and plasma samples using multivariate and univariate approaches. S-plot is generated from OPLS-DA highlighting the contribution of individual lipid species to group separation. Volcano plot showing log2-transformed fold changes and −log10 p-values (two-sided t-test). E Supervised OPLS-DA score plots with cancer samples colored according to tumor stage (T1—yellow, T2—orange, T3—red, T4—rose, and Tx—brown, where information about the stage is not available), and the corresponding S-plots indicate the most upregulated (red) and downregulated (blue) lipid species for plasma and serum models. F Box plots of the most dysregulated lipid species showing differences in concentrations between healthy controls (N, blue; n = 93) and PDAC patients (T, red; n = 88). The number of significance symbols corresponds to p-value ranges from the Mann–Whitney U test; p < 0.0001 is indicated by ****. G Receiver operating characteristic (ROC) curves with the 95% confidence intervals for plasma and serum models in training and validation sets, combining male and female data (prediction scores derived from gender-specific models).
To assess the effect of sample matrix on the lipidome, lipid profiles were compared between plasma and serum using the same cohort of healthy volunteers. Blood collection tubes for the isolation of EDTA plasma and serum were used for each volunteer at the same time. Lipid concentrations were evaluated separately for males and females to eliminate the influence of gender. Significant matrix-related differences were observed for some DG (Figs. 2D and S2D), with approximately 10–30% higher concentrations in serum, particularly for DG 36:X species. No statistically significant differences between plasma and serum were found for other lipid classes (Supplementary Data 6). Minor trends were observed, including slightly lower concentrations of PE, PE P-/O-, and SM, and up to 5% higher concentrations for other lipid classes in serum for both genders, but these differences were not statistically significant.
Lipidomic profiling of PDAC patients and healthy controls
The lipidomic profiling method demonstrates high consistency in the most dysregulated lipid species in nearly all samples, as visualized by the heatmap (Fig. 3A), with similar trends and levels of statistical significance observed between genders (Fig. 3C). A consistent pattern of dysregulation is evident, suggesting disruptions in certain metabolic pathways (Fig. 3B). All 190 quantified lipid species by UHPSFC/MS were used for lipidomic profiling, even though part of lipid species had only low statistical significance, but their cumulative effect on model performance was observed in our previous study40. The downregulation is observed in ceramides and sphingomyelins with very long N-acyl chains (40:1, 40:2, 41:1, 41:2, and 42:1), as well as in plasmenyl/ether phospholipids (36:2, 36:3, 36:4, and 38:4). In contrast, several DG (DG 34:1, 34:2, 36:2, 36:3, and 36:4) are upregulated. These DG species lie at the metabolic crossroads of phospholipid synthesis, while phospholipids with the same acyl chain composition are downregulated. The behavior of PE also varies depending on their structural class—acyl-bonded PE are upregulated, whereas plasmenyl/ether-bound PE P-/O- are downregulated.
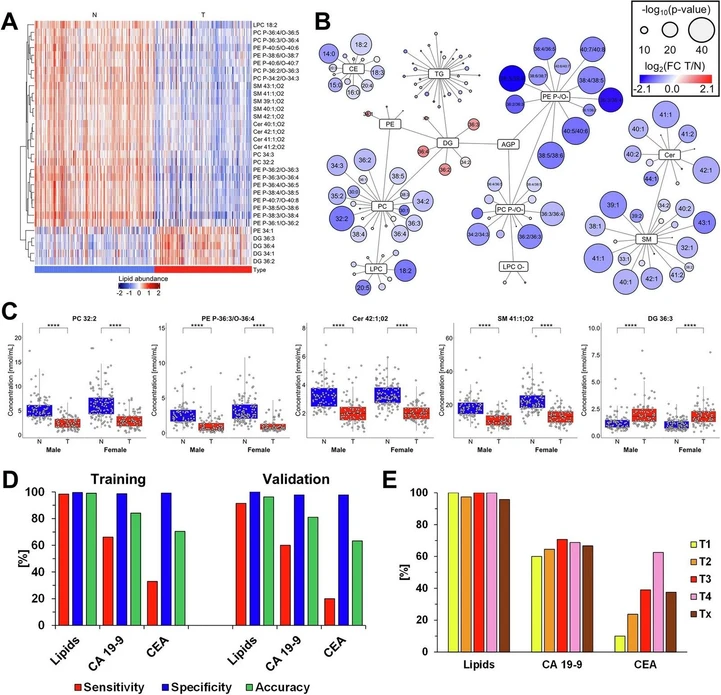 Commun Med 6, 127 (2026): Fig. 3 Plasma lipidomic alterations in PDAC. Results of the lipidomic profiling of PDAC patients (T, tumor) and healthy controls (N, normal) using plasma models. A Heatmap of the most dysregulated lipids, showing the concentrations of lipid species across individual samples. B Network mapping of lipid species, where the size of each circle reflects p-values (two-sided t-test) for individual lipids, and red/blue color saturation represents fold change (T/N). C Box plots of the most dysregulated lipid species visualizing differences in concentrations between PDAC patients (T, red) and healthy controls (N, blue). The number of significance symbols corresponds to p-value ranges from the Mann–Whitney U test; p < 0.0001 is indicated by ****. Study groups: 93 N vs. 88 T of males and 125 N vs. 89 T of females. D Sensitivity (red), specificity (blue), and accuracy (green) based on predictions using the lipidomic profiling method (lipids), carbohydrate antigen 19-9 (CA 19-9), and carcinoembryonic antigen (CEA) in the training and validation sets. E Sensitivity of individual methods according to tumor stages (T1—yellow, T2—orange, T3—red, T4—rose, and Tx—brown, where information about the stage is not available) for the lipidomic profiling method (Lipids), CA 19-9, and CEA in the training set.
The best performing model for differentiating healthy controls from PDAC patients is the gender-specific plasma model, which is used for all subsequent analyses. The lipidomic profiling results were compared with those of the established tumor markers CA 19-9 and CEA in the same set of samples (Fig. 3D). CA 19-9 is commonly used for the diagnosis of pancreatic cancer in symptomatic patients and for monitoring of therapy in these patients, while CEA for monitoring disease progression and tracking the response to treatment in patients with PDAC. Because lipidomic profiling requires prior model training, the dataset was divided into training and validation subsets. The results for CA 19-9 and CEA were assessed using standard threshold values (37 U/mL for CA 19-9 and 5 ng/mL for CEA) and divided in the same subset consistent with the lipidomic profiling. The lipidomic profiling method achieved 99% (95% CI, 97–100%) accuracy in the training dataset and 96% (95% CI, 89–99%) in the validation dataset (averaged across both genders). Specificity was 100% for both datasets (95% CI, 97–100% for training set and 92–100% for validation set), with sensitivity reaching 98% (95% CI, 95–100%) in the training set and 92% (95% CI, 77–98%) in the validation set. In comparison, both CA 19-9 and CEA showed high specificity above 98%, but substantially lower sensitivity—66% (95% CI, 59–73%) and 31% (95% CI, 24–38%) for the training set, and 60% (95% CI, 42–76%) and 20% (95% CI, 8–37%) for the validation set, respectively (Table 3).
Importantly, early-stage tumors (T1 and T2) remain a critical challenge for CA 19-9 and CEA, with markedly reduced sensitivity, whereas the lipidomic profiling method maintains comparable sensitivity across all stages (Fig. 3E). Results for each method are summarized in Supplementary Data 14, and stage-specific sensitivity is provided in Supplementary Data 15. The findings clearly demonstrate the superior diagnostic performance of the lipidomic profiling method, particularly in detecting early-stage of PDAC.