Chloronitramide Anion Quantitation in Tap Waters by Ion Chromatography with Electrical Conductivity and Ultraviolet Absorbance Detection
Environ. Sci. Technol. Lett. 2026, 13, 2, 275–280: Graphical abstract
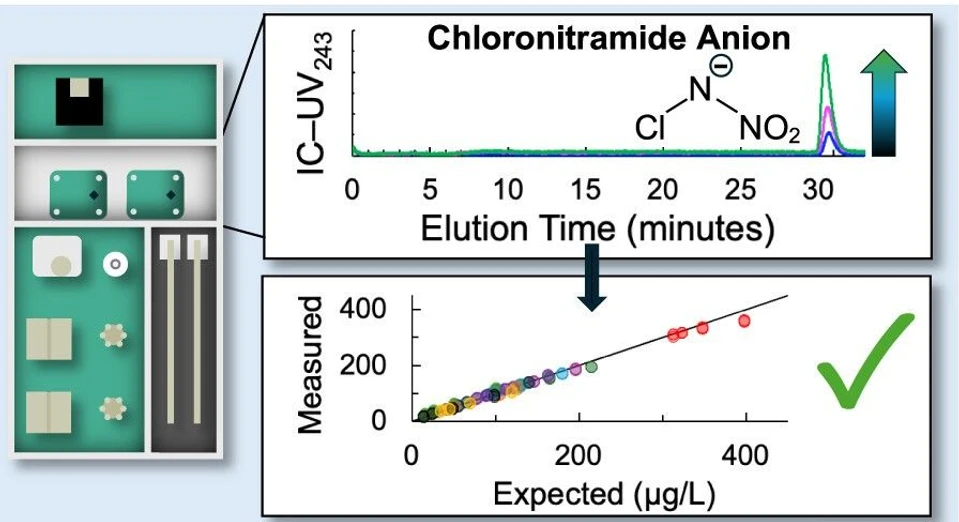
This study evaluates ion chromatography with electrical conductivity and UV absorbance detection for quantifying chloronitramide, a recently identified chloramine decomposition product, in tap water. Method performance showed strong agreement with HILIC–UHRMS results, enabling reliable detection across diverse water matrices.
Chloronitramide was detected in both chloraminated and free chlorine systems, marking its first reported occurrence in the latter. The developed IC methods support large-scale monitoring of chloronitramide in drinking water, with UV detection providing reduced measurement bias and improved analytical reliability.
The original article
Chloronitramide Anion Quantitation in Tap Waters by Ion Chromatography with Electrical Conductivity and Ultraviolet Absorbance Detection
Jason A. Thornhill, Juliana R. Laszakovits, Barrett E. Johnson, Justin R. Chimka, and Julian L. Fairey*
Environ. Sci. Technol. Lett. 2026, 13, 2, 275–280
https://doi.org/10.1021/acs.estlett.5c01218
licensed under CC-BY 4.0
Selected sections from the article follow. Formats and hyperlinks were adapted from the original.
After ∼45 years since it was first detected in chloraminated water (1) and more than 30 years since its prior characterization efforts, (2−5) chloronitramide anion (Cl–N–NO2–) was identified as a decomposition product of inorganic chloramines. (6) In a limited survey of chloraminated tap waters in the United States, Cl–N–NO2– was found in all samples tested (n = 40) at a median concentration of 23 μg L–1 and first and third quartiles of 1.3 and 92 μg L–1, respectively. Although its toxicity is currently unknown, Cl–N–NO2– forms at levels comparable to some regulated disinfection byproducts (DBPs) but lower than others. For example, the Environmental Protection Agency (EPA) maximum contaminant levels (MCLs) for the mass-based sums of four trihalomethanes is 80 μg L–1 and five haloacetic acids is 60 μg L–1; (7) however, the chlorite MCL is over 1 order of magnitude greater, at 1 mg L–1. The Cl–N–NO2– formation pathway contrasts that of most other DBPs, which are formed by reactions between a disinfectant and source water precursors, such as natural organic matter (NOM) and/or bromide. (8,9) Cl–N–NO2– is formed by monochloramine (NH2Cl) or dichloramine (NHCl2) reacting with nitronium cation (NO2+), (6) a reactive nitrogen species formed during chloramine decomposition. (10,11) In this regard, Cl–N–NO2– is an intrinsic DBP, (12) like chlorate and perchlorate in hypochlorite feedstocks. (13−16) As chloramines are inherently unstable and autodecompose under typical conditions in drinking water systems, (17−19) Cl–N–NO2– is likely present in all waters where chloramines are used. This includes systems where chloramines are formed intentionally and free chlorine systems containing source water ammonia. (20) To facilitate Cl–N–NO2– occurrence studies and better understand its formation in tap water, analytical methods are needed for Cl–N–NO2– quantitation that leverage common instrumentation in drinking water laboratories.
The discovery of Cl–N–NO2– was supported by its quantitation in chloraminated tap waters by hydrophilic interaction liquid chromatography–ultrahigh-resolution mass spectrometry (HILIC–UHRMS). (6) This method has a limit of detection (LOD) of 0.17 μg L–1 and a limit of quantitation (LOQ) of 0.58 μg L–1. However, the instrumentation required for HILIC–UHRMS (i.e., orbitrap mass spectrometers) is not widely accessible due to its high capital cost and operation and maintenance requirements, limiting collection of Cl–N–NO2– occurrence data. Cl–N–NO2– reference materials were previously isolated from mixtures containing common anions (e.g., chloride, nitrite, nitrate, sulfate, phosphate) at concentrations up to ∼100 mM using ion chromatography (IC) with electrical conductivity (EC) and ultraviolet absorbance (UV) detectors. (6) Given Cl–N–NO2– is an anion and has a molar absorptivity (ε) peak maxima at 243 nm of ε243 = 5,310 M–1 cm–1, (6) Cl–N–NO2– quantitation may be possible by IC-EC and/or IC-UV243, but the applicability of these methods at μg L–1 levels is unknown. IC methods could be a cost-effective alternative to MS-based methods and adopted at drinking water utilities and commercial water analysis laboratories, enabling widescale Cl–N–NO2– occurrence studies. The objective of this study is to assess IC-EC and IC-UV243 for Cl–N–NO2– quantitation in tap waters at μg L–1 levels. Cl–N–NO2– quantitation by IC-EC and IC-UV243 was compared to HILIC–UHRMS across an unprecedented range of Cl–N–NO2– concentrations in tap waters from U.S. residential homes.
2. Materials and Methods
2.1. Ion Chromatography System
A Metrohm 850 Professional IC equipped with an autosampler, suppressor, two electrical conductivity detectors, and an 887 Professional UV/vis detector was used to isolate Cl–N–NO2– standard reference materials and quantify Cl–N–NO2– in tap waters. Two Metrosep A Supp 7 separation columns were used, each 250 mm in length with a 4.0 mm diameter, one for Cl–N–NO2– isolation that had been used extensively (>10,000 injections) and regenerated to maintain adequate anion separation and the second newly acquired for Cl–N–NO2– quantitation in drinking water matrices. Both IC columns consist of a PEEK housing packed with a poly(vinyl alcohol) carrier material with quaternary ammonium groups, 5 μm particle size, 15 MPa maximum pressure, 1.0 mL min–1 maximum flow rate, pH range 3–12, and temperature range of 20–60 °C. Na2CO3 eluent concentrate (Metrohm) was diluted 100× to 3.6 mM for Cl–N–NO2– isolation and 25× to 14.4 mM for Cl–N–NO2– quantitation.
3. Results and Discussion
3.4. Tap Water Comparison of IC and HILIC–UHRMS
Figure 2 shows Cl–N–NO2– concentrations in the 12 tap waters measured by IC-EC and IC-UV243 peak area compared to the HILIC–UHRMS method developed in prior work. (6) Figure s30 shows these data for peak height.
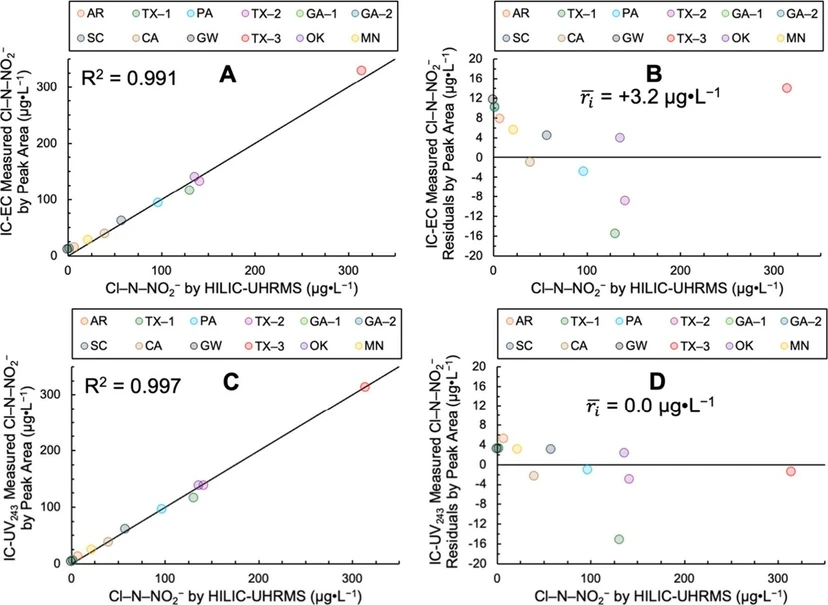 Environ. Sci. Technol. Lett. 2026, 13, 2, 275–280: Figure 2. Ion chromatography-electrical conductivity (IC-EC, Panels A and B) and -ultraviolet absorbance at 243 nm (IC-UV243, Panels C and D) comparison testing with HILIC–UHRMS for Cl–N–NO2– quantitation in 12 waters which included eight chloraminated tap waters (TX-1, PA, TX-2, SC, CA, TX-3, OK, and MN), three chlorinated tap waters (AR, GA-1, and GA-2), and one synthetic groundwater (GW) with no added disinfectant. (A) IC-EC measured by peak area vs Cl–N–NO2– determined by HILIC–UHRMS, (B) IC-EC residuals by peak area, (C) IC-UV243 measured by peak area vs Cl–N–NO2– determined by HILIC–UHRMS, and (D) IC-UV243 residuals by peak area. The solid black line in Panels A and C is the 1:1 line and shown with the correlation coefficient, R2. The average residual ( 𝑟𝑖⎯⎯⎯ ; n = 12) in μg L–1 is shown in Panels B and D as a measure of the linear regression model bias and accuracy with values closer to zero indicating lesser overall bias.
Cl–N–NO2– quantified using the IC methods tracked the 1:1 line across the range of Cl–N–NO2– concentrations in the tap waters from not detected to 315 μg L–1, indicating they were strongly correlated with the HILIC–UHRMS measurements. For IC-EC, the R2 (n = 12) was 0.991 (Figure 2A) and the average residual (
We demonstrated that IC-EC and IC-UV243 can be used to accurately quantify Cl–N–NO2– in tap waters with minor modifications to the IC system (i.e., 5 mL injection loop and 14.4 mM Na2CO3 eluent) using standards formulated in 1 mM borate buffer at pH 9. While the lowest LOD (5.8 μg L–1) and LOQ (8.2 μg L–1) are greater than those for HILIC-UHRMS (0.17 and 0.58 μg L–1, respectively), the IC methods are accurate within an environmentally relevant range, with Cl–N–NO2– at levels up to about 315 μg L–1. Spike recovery experiments indicate matrix effects were negligible for Cl–N–NO2– quantitation by IC-EC and IC-UV243 for concentrations <50 μg L–1 (i.e., P<50 μg L–1 > 0.05). IC-based quantitation methods were strongly correlated with HILIC–UHRMS (R2 ≥ 0.991) and unbiased for quantitation by IC-UV243 peak area. Cl–N–NO2– may continue to form in tap waters containing a chloramine residual, particularly at pH ≲ 8 where chloramines decompose more readily. (29) A quenching agent/procedure has not yet been identified for chloramines that does not impact Cl–N–NO2–. Thus, the time between sample collection and analysis should be minimized (<1 day, if possible) to get the most accurate assessment of Cl–N–NO2– occurrence until if/when a suitable sample preservation procedure is developed. Nevertheless, the IC methods developed and validated here can be adopted by water utilities and testing laboratories for widespread Cl–N–NO2– monitoring campaigns.