From Chemistry to Functionality - HPLC–DAD/LC–MS/MS Characterization of Bee Product-Enriched Prunus spinosa L. Kombucha with In Vitro Antidiabetic Activity and Bioaccessibility
ACS Omega 2026, 11, 8, 14048–14063: Graphical abstract
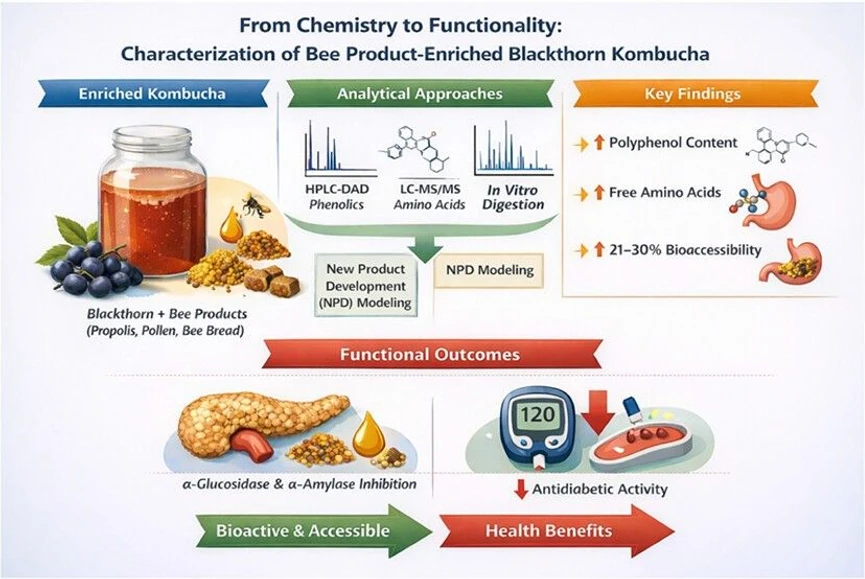
This study investigates the optimization and functional properties of kombucha enriched with Prunus spinosa juice and bee products (propolis, pollen, and bee bread). Advanced analytical techniques (HPLC–DAD, LC–MS/MS) revealed enhanced phenolic, amino acid, and antioxidant profiles, with bee bread enrichment showing the highest overall bioactive content and sensory acceptance.
Propolis-enriched kombucha exhibited the strongest in vitro antidiabetic activity, while pollen enrichment provided the highest amino acid levels. Despite partial losses during digestion, significant retention of bioactives suggests potential postdigestive benefits. These findings highlight the potential of enriched kombucha as a functional beverage with nutraceutical value.
The original article
From Chemistry to Functionality: HPLC–DAD/LC–MS/MS Characterization of Bee Product-Enriched Prunus spinosa L. Kombucha with In Vitro Antidiabetic Activity and Bioaccessibility
ACS Omega 2026, 11, 8, 14048–14063
https://doi.org/10.1021/acsomega.6c00008
licensed under CC-BY 4.0
Selected sections from the article follow. Formats and hyperlinks were adapted from the original.
Kombucha tea, a traditionally fermented beverage, is believed to have originated as early as 200–300 BC. In recent decades, it has attracted growing global interest due to its recognized health-promoting properties and its deep cultural roots. (1,2) Sweetened tea derived from Camellia sinensis is transformed into kombucha through fermentation carried out by a SCOBY (Symbiotic Culture of Bacteria and Yeast), a mixed culture of yeasts and bacteria that forms a cellulose-rich biofilm throughout the process. (3) SCOBY represents a symbiotic consortium of microorganisms that comprises various yeast genera, including Saccharomyces, Schizosaccharomyces, Zygosaccharomyces, Brettanomyces/Dekkera, and Pichia, as well as both acetic and lactic acid bacteria. (2) During fermentation, the sugars formed contribute a mild sweetness to the tea, whereas the organic acids synthesized by acetic acid bacteria are responsible for its distinctive sour flavor. (4) Kombucha tea is traditionally brewed using black tea; however, alternative versions can also be produced with other types of tea. (5) It has been reported that herbal infusions and fruit juices can also be used for fermentation with the kombucha culture, and due to their chemical composition, these substrates have been shown to serve as promising alternatives. (6) The antioxidant potential of kombucha tea is primarily linked to its abundant phenolics, with flavonoids playing a significant contributory role. (7) A high anthocyanin content tends to enhance the antioxidant capacity. (8) The antioxidant activity of kombucha tea can be improved by incorporating anthocyanin-rich fruits. Accordingly, the use of wild fruits with high anthocyanin content─such as Prunus spinosa L. (blackthorn), Prunus laurocerasus (cherry laurel), and Rubus idaeus (red raspberry)─has been considered a practical way to improve the beverage’s nutritional, functional and sensorial properties. (9)
Propolis is a naturally occurring material that honeybees gather from the resins of different trees and the buds of various plants. (28,29) Propolis is a chemically complex matrix comprising more than 300 identified components, including flavonoids, phenolic acids, and their ester derivatives, and is associated with a wide range of biological activities such as antiviral, antioxidant, antimicrobial, anti-inflammatory, antitumor, hepatoprotective, and immunomodulatory effects. (30−34) Minerals and vitamins are also present in high concentrations in propolis. (28) Bee pollen is formed when bees agglutinate pollen grains using their saliva, nectar, or honey and store them in granular form in their honeycomb cells. The key role of bee pollen is to ensure the colony’s survival by providing the necessary nutrients, thereby supporting development and maintenance processes. (35) Bee pollen is a natural product rich in bioactive compounds. More than 250 bioactive compounds have been identified in bee pollen derived from different plant species. These basic chemical components include lipids, amino acids, proteins, carbohydrates, fatty acids, phenolic compounds, carotenoids, flavonoids, vitamins, and bioelements. (36) Exhibits antihyperglycemic, anti-inflammatory, hepatoprotective, nephroprotective, and anticancer properties thanks to its rich and versatile component mixture. (37,38) Many of these have demonstrated antioxidant, antimicrobial, antidiabetic. They have shown promising results in the treatment of diabetes and obesity, and their potential as natural therapeutic agents has been evaluated. They have been found to increase insulin sensitivity, reduce oxidative stress, regulate appetite, adjust obesity-related hormone levels, and strengthen antioxidant defense systems. (39,40) The antimicrobial effect of bee bread has been extensively studied. Bakour et al. found that different bacterial species and fungi are sensitive to the hydromethanolic bee bread extract. (41) A vital bee byproduct, bee bread is formed after the pollen gathered by bees is enriched with nectar and bee saliva, leading to an ensuing lactic acid fermentation process inside the hives. (42) Bee bread is high in nutrition, with significant carbohydrates, proteins and lipids. It is a rich source of vitamins, phenolic compounds, minerals and essential amino acids, and exhibits multiple chemical activities. (43,44)
The Response Surface Method (RSM) is one of the statistical optimization approaches. This method uses empirical modeling techniques to identify relationships between independent variables and the system response using experimental data. It also allows for determining optimal conditions for achieving the desired outcome by evaluating the effects of process variables on the system response. (45−47)
Previous studies have not extensively investigated the sensory parameters (color, taste, smell, and general acceptance) of kombucha tea enriched with P. spinosa L. and bee products using RSM. The primary aim of this study was to optimize the sensory properties of kombucha formulations enriched with P. spinosa L. and bee-derived ingredients (bee bread, propolis, and pollen) using RSM to determine the most acceptable formulation. While many studies have examined kombucha enriched with various fruit and plant infusions, none have specifically investigated the impact of P. spinosa L. and bee products on kombucha’s sensory and bioactive properties. The study also evaluated the total phenolic content (TPC), total flavonoid content (TFC), antioxidant activity (DPPH•), total anthocyanin content (TAC), phenolic profile (HPLC), microbiological quality, and levels of organic acids amino acids and in vitro bioaccessibility in the developed samples, as well as their antidiabetic activity. RSM-based optimization offers a new methodological approach. It is expected to yield valuable data. This data will improve the functional and disease-fighting properties of kombucha.
2. Materials and Methods
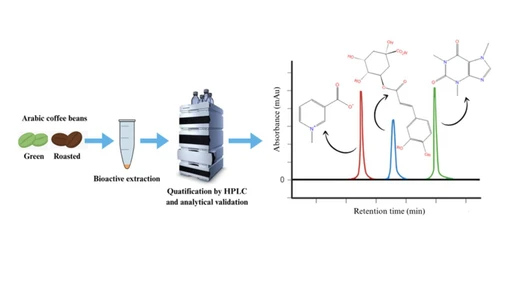
2.9. Analysis of Phenolic Compounds (HPLC)
Chromatographic separation was carried out on an ACE Genix C18 column (250 × 4.6 mm, 5 μm; Agilent), following the procedure reported by Portu et al. (2017). (56) Phenolics were characterized using an Agilent 1260 HPLC–DAD system operated under gradient conditions at 30 °C with a flow rate of 0.80 mL/min. The mobile phase comprised solvent A (water supplemented with 0.1% phosphoric acid) and solvent B, applied according to a predefined gradient program. Samples were injected at a volume of 10 μL, and chromatograms were recorded at 280, 320, and 360 nm. Quantitative results were reported as μg/mL.
2.10. Analysis of Organic Acids (HPLC)
HPLC was used to determine organic acid profiles, following a method adapted with minor modifications from Coelho et al. (57) Organic acids were analyzed using an Agilent 1260 Infinity LC HPLC system fitted with refractive index (RID) and diode array (DAD) detectors. Samples were filtered through a 0.45 μm syringe filter, and a 20 μL aliquot was injected into an Agilent Hi-Plex H ion-exchange column (300 × 7.7 mm). Chromatographic separation was carried out using 10.0 mM H2SO4 as the mobile phase at a flow rate of 0.6 mL/min, with the column temperature set to 65 °C and the RID cell maintained at 35 °C. The total run time was 20 min. DAD additionally monitored tartaric, pyruvic, and acetic acids at 210 nm. Quantitative determination was carried out using external calibration standards, and the results were reported in g/L.
2.11. Determination of Free Amino Acids (LC–MS)
Amino acid composition was determined using a method adapted with minor modifications from the procedure described by Bilgin et al. (2019). (58) A gradient elution scheme involving mobile phases A and B was applied to obtain chromatographic separation at a flow rate of 0.7 mL/min, yielding a total run duration of 7.5 min. Tandem mass spectrometric analyses were performed on an Agilent 6460 triple quadrupole LC–MS instrument (Agilent Technologies, Waldbronn, Germany) fitted with an electrospray ionization (ESI) interface. The mass spectrometer was operated with a gas temperature of 150 °C, a gas flow rate of 10 L/min, a nebulizer pressure of 40 psi, and a capillary voltage of +2000 V. All analyses were carried out in triplicate, and the results were reported as mg/100 mL.
3. Results and Discussion
3.4. Phenolic Compounds (HPLC)
As presented in Table 1, the total quantified phenolic content differed significantly among the treatments (p < 0.05). The control sample (BKT) exhibited the lowest phenolic concentration (106.35 ± 2.25 μg/mL), whereas pollen supplementation (PL-BKT) resulted in a substantial increase, reaching 159.23 ± 4.82 μg/mL. Further enhancement of the phenolic pool was achieved through propolis (PB-BKT: 178.66 ± 5.04 μg/mL) and bee bread (BB-BKT: 186.15 ± 0.97 μg/mL) supplementation. No statistically significant difference was observed between PB-BKT and BB-BKT in total quantified phenolics; however, both treatments exhibited significantly higher values than PL-BKT and the control, indicating a more pronounced phenolic enrichment.
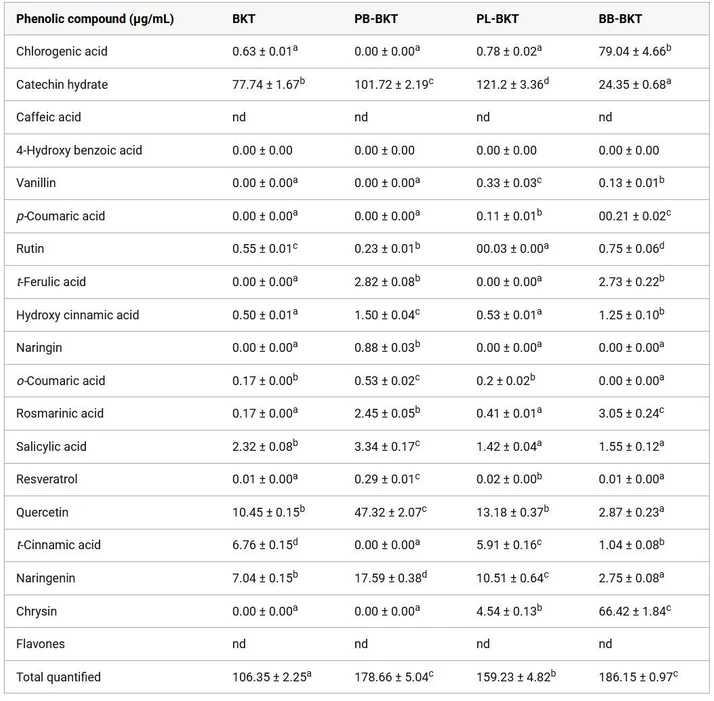 ACS Omega 2026, 11, 8, 14048–14063: Table 1. Changes in Total Phenolic Compounds of Kombucha Samples Subjected to BKT, PB-BKT, PL-BKT and BB-BKT. Data are presented as mean ± standard deviation (n = 3). Values denoted by different letters within the same row indicate statistically significant differences (p < 0.05). BKT: Blackthorn kombucha tea; PB-BKT: Propolis blackthorn kombucha tea; PL-BKT: Pollen blackthorn kombucha tea; BB-BKT: Bee bread blackthorn kombucha tea. n.d.: could not be detected.
The compound-level distribution suggests that the observed elevation in total phenolics is driven by selective, matrix-dependent enrichment. Bee bread is a functional food thanks to its bioactive compounds and chemical diversity. (72) The marked increase in chlorogenic acid concentration in BB-BKT, to 79.04 ± 4.66 μg/mL, was a key contributor to the elevated total phenolic content in this group. In contrast, chlorogenic acid remained undetectable or present at negligible levels in the other treatments. Likewise, the enrichment of thermosonicated kiwi juice with bee bread resulted in a statistically significant elevation in chlorogenic acid levels. (68) The highest catechin hydrate concentration was observed in PL-BKT (121.2 ± 3.36 μg/mL), indicating that pollen supplementation preferentially enhances the flavan-3-ol fraction. In contrast, the markedly elevated levels of quercetin (47.32 ± 2.07 μg/mL) and naringenin (17.59 ± 0.38 μg/mL) detected in PB-BKT support the flavonoid-enriching effect of propolis (p < 0.05). In another study, propolis supplementation of thermosonicated yellow cherry juice was found to increase quercetin content significantly. Additionally, the exclusive emergence of chrysin in the enriched samples, particularly its pronounced accumulation in BB-BKT (66.42 ± 1.84 μg/mL), suggests that bee bread supplementation can substantially reshape the specific phenolic signature of the matrix. This interpretation is further supported by the highest rosmarinic acid level observed in BB-BKT (3.05 ± 0.24 μg/mL). Conversely, the absence of caffeic acid and the flavones fraction across all treatments (n.d.) indicates that the applied interventions exerted limited effects on specific phenolic subclasses.
3.5. Free Amino Acids (LC–MS)
The PL-BKT sample, which was supplemented with pollen, exhibited the highest free amino acid content (see Table 2). This outcome differed significantly from all other groups (p < 0.05). Significant increases were observed in proline (47.37 mg/100 mL), leucine (4.10 mg/100 mL), and lysine (4.54 mg/100 mL), indicating that pollen, due to its high protein content, increases amino acid release during fermentation. In contrast, amino acid levels were lower in the sample supplemented with propolis alone (PB-BKT), and some amino acids (e.g., glutamic acid, histidine, threonine) were not statistically different from the BKT sample (p > 0.05).
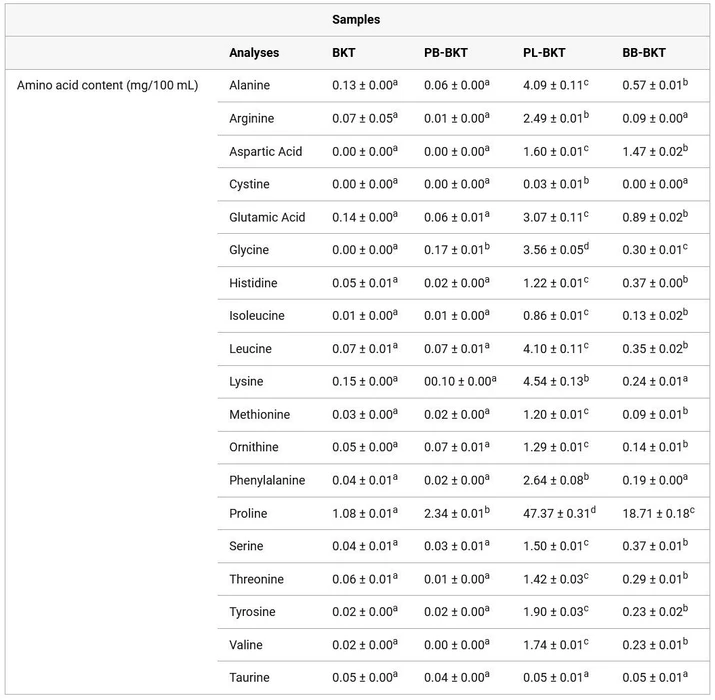 ACS Omega 2026, 11, 8, 14048–14063: Table 2. Effects of BKT, PB-BKT, PL-BKT and BB-BKT on Free Amino Acids (mg/100 mL). The mean value, along with the standard deviation, is given for the data (n = 3). Values indicated by different letters within the same row differ significantly (p < 0.05). BKT: Blackthorn kombucha tea; PB-BKT: Propolis blackthorn kombucha tea; PL-BKT: Pollen blackthorn kombucha tea; BB-BKT: Bee bread blackthorn kombucha tea.
4. Conclusions
This study demonstrated that kombucha enriched with P. spinosa L. juice and bee products (propolis, pollen, and bee bread) provides a robust model for functional beverage design through RSM-based optimization and advanced analytical characterization (HPLC–DAD, LC–MS/MS). From a sensory perspective, the highest overall acceptability was observed in the bee bread-enriched sample (8.32), which also exhibited the strongest antioxidant response (TPC 257.10 mg GAE/100 mL; TFC 36.16 mg CE/100 mL; DPPH• 57.05 μmol TE/mL). HPLC–DAD data revealed that total phenolics increased to 159.23–186.15 μg/mL following enrichment, and that marker compounds, such as chlorogenic acid and catechin derivatives, varied depending on the formulation. LC–MS/MS supported an increase in free amino acids (particularly proline) with pollen supplementation. Propolis addition highlighted the antidiabetic potential, yielding the highest enzyme inhibition (α-glucosidase: 40.7%; α-amylase: 42.02%). Although a partial reduction in bioactives was observed during in vitro digestion, the preservation of phenolic/flavonoid recovery within approximately the 21–30% range indicates that postdigestive activity may be sustained. Future studies are recommended to expand biomarkers using targeted/untargeted LC–HRMS-based metabolomic approaches, to correlate SCOBY microbiota (16S/ITS) with chemical profiles, and to evaluate shelf life and packaging stability (phenolic degradation kinetics, volatile profile), as well as in vivo/preclinical validation (glycemic response, bioaccessibility). A limitation of this work is that batch-specific botanical origin (palynological) identification of the commercial bee products was not performed; therefore, compositional variability due to botanical source cannot be fully excluded.