A Novel Compact Multi-Reflecting Time-of-Flight Mass Spectrometer
J. Am. Soc. Mass Spectrom. 2026, 37, 3, 601–611: Graphical abstract
This study presents a novel compact quadrupole time-of-flight LC-MS/MS system featuring a multireflecting orthogonal TOF analyzer, advanced collision cell, and high dynamic range detector. The instrument achieves up to 100,000 FWHM resolution while acquiring spectra at speeds up to 100 spectra/s.
The platform demonstrated excellent linearity across a dynamic range of 10⁵ and balanced performance in speed, resolution, and sensitivity. Its capabilities were validated through analysis of isotopically labeled lipids in human plasma, highlighting its potential for high-throughput metabolomics, lipidomics, and proteomics applications.
The original article
A Novel Compact Multi-Reflecting Time-of-Flight Mass Spectrometer
Anatoly N. Verenchikov*, Jason Wildgoose, Sergey N. Kirillov, Aleksey V. Vorobyev, Vasily V. Makarov, Lee A. Gethings, Robert P. Tonge, Matthew E. Daly, William J. Johnson, and James I. Langridge
J. Am. Soc. Mass Spectrom. 2026, 37, 3, 601–611
https://doi.org/10.1021/jasms.5c00321
licensed under CC-BY 4.0
Selected sections from the article follow. Formats and hyperlinks were adapted from the original.
Time-of-Flight Mass Spectrometry (TOFMS) has been a cornerstone analytical technology, experiencing several periods of resurgence within mass spectrometry. (1) The evolution began with GC-TOF in the 1960s, followed by a renaissance in the 1990s driven by the introduction of Matrix-Assisted Laser Desorption/Ionization (MALDI) (2−5) and the rapid MS/MS capabilities of ESI-Q-TOF instruments. (6,7) Orbitrap analyzer based mass spectrometers were introduced in the 2000s, (8,9) which also excelled in resolution, mass accuracy, and sensitivity, significantly impacting the rapidly evolving field of proteomics.
However, as demands for higher throughput and improved ion source sensitivity increased, limitations in speed and dynamic range became evident. Modern ESI sources can generate ion fluxes reaching 6 × 10⁹ ions/s. This significantly exceeds the capacity of Orbitrap analyzers, which can typically handle not more than 106 charges/spectrum at low analysis frequencies (2 Hz), while maintaining 100,000 FWHM resolution. (9) The effective utilization of the ion influx is limited compared to the claimed 90% duty cycle of ion trapping pulse converters. (9) Furthermore, the coalescence effect severely restricts the intensity of individual peaks when resolving closely spaced isobars, (10) obscuring the robust and high-throughput analysis of complex mixtures with overlapping isotopic patterns. (11)
A TOFMS resurgence was driven by the development of multireflecting instruments (MRTs). (12,13) MRT technology offers high resolution comparable to Orbitraps, but at significantly higher analysis speeds. Commercial examples include the GC-HRT, (14) SELECT SERIES MRT, (15) Astral, (16) and the Xevo MRT mass spectrometer presented here. The difference in ion optical schemes and parameters of these MRT analyzers is thoroughly described in the recent review. (13)
Early MRT instruments focused on improving resolution through substantial elongation of the folded flight path, particularly within the Y-injection scheme. (13) In Y-MRT, a continuous ion beam is injected orthogonal to the analyzer’s midplane (along the Y-axis). This enables narrow beam width (1–2 mm) in the drift Z-direction, a dense folding (at 10 mm Z-pitch) and substantial elongation of ion trajectory in the analyzer. Despite long flight path (100 m), ion packets stay confined with the aid of a periodic lens in the drift space. While achieving resolution up to 1,000,000, (17) Y-MRT designs suffered from low duty cycles affected by both short ion packets Y-length (5 mm) and long period (2.5 ms for m/z = 1000 Th). Duty cycle enhancements via encoded frequent pulsing (12) and the Pulsar method (18) improved throughput and allowed to recover the duty cycle up to 10% but encountered dynamic range limitations at the spectral decoding step or space charge limitations in the Pulsar method.
Over the past decade, researchers have explored an alternative MRT design utilizing a conventional orthogonal accelerator (OA) aligned with the drift direction, analogous to OA-TOFMS. (19−21) This orthogonal-MRT (o-MRT) scheme allows for an extended OA, significantly boosting the duty cycle, further extended with ion accumulation in radiofrequency ion guides. (22,23) Additionally, aligning ion packets along the drift axis minimizes analyzer aberrations, further enhanced by optimized ion mirror fields. To distinguish this design from Y-injection MRT, we refer to it as “o-MRT.” Several o-MRT prototypes have been developed using both ElectroSpray Ionization (ESI) (24) and electron ionization (EI) (25) ion sources.
The o-MRT concept has been further developed and recently commercialized by Waters Corporation with the introduction of the Xevo-MRT at the Annual Conference on Mass Spectrometry and Allied Topics in 2024. Here, we report details of the instrument design, including ion simulation data, and some of the key performance measures resolution, dynamic range, sensitivity, and mass accuracy. We then illustrate the application of the instrument to an liquid chromatography–mass spectrometry (LC-MS) lipidomics workflow with human blood plasma lipids.
Lipid identification and quantification in biological samples poses significant analytical challenges. (26) The inherent complexity of biological samples, including the wide dynamic range and matrix effects, leads to frequent chromatographic and mass separation overlaps. Furthermore, instrument sensitivity can vary by orders of magnitude for specific analyte types and classes. These factors necessitate mass spectrometers with high dynamic range (>104), resolution (>100,000 FWHM), and mass measurement accuracy (<1 ppm RMS) that allow for reliable lipid analysis.
Experimental Section
Instrument Design and Operation
Design Overview of the Quadrupole Compact MRT Instrument
The compact-MRT design is shown in Figure 1A, consisting of the following components: 1- LC separation systems; 2 - closed ion source, accepting various ionization modes and probe types; 3 - a heated nozzle with gas channels; 4 - dual stage traveling wave ion guides (TWIG); 5- MS1- analytical quadrupole for precursor ion selection; 6 - collision cell; 7 - lens system; 8- gridless orthogonal accelerator (OA) with a 9 -trans-axial exit lens; 10 - MRT housing; 11 - opposed gridless ion mirrors; 12 - simulated ion trajectories; 13- floated drift space; 14 - detector; 15 - dual gain preamplifier; 16 - ADC; 17 - GPU for data processing and PCU for data summation and storage. The white arrows show the placement of the mechanical and turbo-molecular pumps. Each subcomponent can be described in more detail as follows.
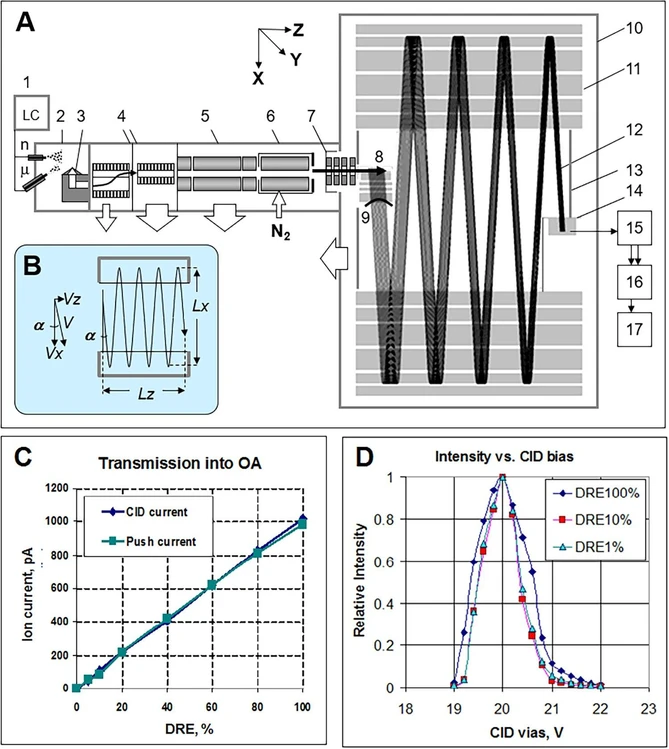 J. Am. Soc. Mass Spectrom. 2026, 37, 3, 601–611: Figure 1. Overview of Xevo MRT: (A) Main components of the instrument and simulated ion trajectories in the analyzer. (B) Principles of the ion trajectory control and the main analyzer dimensions (500 mm (Lx) and 250 mm (Lz)). (C) Ion currents into the gas cell and accelerator (measured on the Push electrode) vs interface muting with the method of Dynamic Range Enhancement (DRE). (D) Ion transmission onto the detector vs gas cell bias, illustrating the control of ion trajectories and effect of stronger ion currents in the gas cell.
LC and ESI Source (Figure 1A, Components 1–2)
An ACQUITY Premier FTN UPLC system (Waters Corporation, Milford, MA), incorporating a flow-through needle and ACQUITY Premier CSH C18 Column 1.7 μm, 2.1 mm × 100 mm (Waters Corporation, Milford, MA) separation column was coupled to the closed ESI source for the applications described in this manuscript. Besides conventional ESI, nanoflow ESI or Atmospheric Pressure Chemical Ionization (APCI) sources can be interfaced to the instrument. All probes utilize a nebulizing gas for spray stability. An additional ESI probe is fed with a reference compound with the aid of a Waters Reagent Delivery System (Waters Corporation, Wilmslow, U.K.) or a syringe pump, which can be alternately selected using an electrically driven baffle
Front-End Interface (Figure 1A, Components 3–4)
Ions are sampled via heated cone with a 0.5 mm aperture (Nozzle, 1) followed by a curved heated channel for the removal of the ESI aerosol. Two stages of Traveling Wave Ion Guide (TW, 2) are pumped by a 100 m3/h dry pump (EV-SA20 Ebara, Japan) and the first stage of a dual stage turbo-molecular pump operating at ∼200 L/s (Edwards, U.K.) to gas pressures of ∼2.5 mbar and ∼2 × 10⁻² mbar, respectively. The first TW-guide has two offset channels to remove droplet residuals. The combination of Radio Frequency (RF) and TW signals in ion guides allow for radial ion confinement and for rapid ion transfer, which eliminates space charge build up. The front-end interface is characterized by an effective removal of ESI droplets and by high ion transmission range ion currents.
Analytical Quadrupole (AQ) (Figure 1A, Component 5)
A 130 mm long AQ (5) with 10 mm inscribed diameter is used for precursor ion selection in MS/MS experiments. Entrance and exit Brubaker rods of 15 mm length are used to enhance the AQ ion transmission close to 100% when selecting mass windows greater than 2 m/z. The AQ is terminated by a timed gate for rapid and quantitative suppression of ion signal, providing Dynamic Range Enhancement (DRE) functionality as detailed below. (27) The AQ region is pumped down by the second stage of a dual stage turbo-molecular pump operating at ∼300 L/s (Edwards, U.K.) to a gas pressure of ∼3 × 10⁻⁵ mbar. The AQ is energized by an RF/DC generator. For a mass range up to 8000 m/z, the RF frequency is 597 kHz. The generator allows for rapid mass scanning (up to 10,000 Da/s), fast switching (down to 1 ms dwell time), and for adjustments of mass selection window (from 2 to 100 m/z). Furthermore, the generator allows to transmit a wide mass range by switching off the DC voltage between rods, affording rapid switching between full mass range and selected mass range transmissions.
Gas Cell (Figure 1A, Component 6)
The gas cell is a key component of the instrument, specifically designed for efficient ion manipulation. This sealed cell operates with N2 gas (indicated by a white arrow in Figure 1) at a pressure of ∼1.5 × 10⁻² mbar. The gas cell entrance features a 2 mm diameter aperture that is designed to efficiently capture ions over a wide range of energy to charge ratios (2–100 V) from the AQ. The 3 mm diameter segmented quadrupole provides enhanced ion confinement enabling high transmission to and through downstream devices. The cell is powered by an RF generator operating at a frequency of 5 MHz and a programmable amplitude of up to 1.2 kV (peak-to-peak). This configuration allows for transmission of a broad mass range of ions, starting from as low as m/z 50.
The collision energy (CE), which refers to the ion energy upon injection into the gas cell, is controlled by a DC bias applied to the front-end interface. This allows for rapid switching of the injection energy within 1 ms. At low CE values (3–5 V), ions primarily pass through the cell with minimal fragmentation. In MS/MS experiments, the CE is dynamically adjusted based on the mass-to-charge ratio (m/z) and charge (z) of the selected ions to achieve optimal fragmentation for structural elucidation.
Axial DC voltage gradients between segments within the gas cell enable rapid MS/MS adjustments. This design allows swift ion transfer within the cell, typically on a 1 ms time scale. The energy of ions exiting the cell is controlled by the DC bias applied to the exit portion. To maintain a constant ion beam energy, the exit DC bias is typically set to Kz = 22 V. A combination of axial DC gradients and of sufficient ion damping results in a low spread in the axial ion energy-to-charge ratio (dKz) of typically less than 0.5 V, even when transmitting ion currents up to 1 nA. As described below, the low energy spread is essential for effective ion transmission.
MRT Analyzer (Figure 1A, Component 10 and Internals)
The design of the analyzer offers exceptional focusing capabilities and a high-vacuum environment, making it well-suited for high-resolution analysis for a variety of biomolecules. A planar design is employed, consisting of two parallel ion mirrors with rectangular frames elongated in the Z-direction (drift direction) for enhanced focusing. Thick electrodes ensure mechanical stability and precise mirror alignment (∼20 μm).
The analyzer prioritizes grid-free designs for both the OA and ion mirrors. This approach eliminates potential ion losses that could occur due to interactions with meshes during multiple ion reflections. For instance, if an MRT instrument with N = 8 reflections was constructed using grid-covered dual-stage mirrors, the overall analyzer transmission would plummet to a mere 3% (0.932) - assuming a 90% transmission efficiency per individual mesh.
Results
Resolution
Figure 3A shows the MS/MS spectrum of [Glu1]-Fibrinogen peptide B (GFP), (EGVNDNEEGFFSAR, C66H95N19O26, Sigma-Aldrich, St. Louis, MO) infused at a concentration of 10–7 M. The doubly charged precursor was selected by the AQ at 5 Th mass window to admit the entire isotopic envelope. Precursor ions were injected into the CID collision cell at 27 V energy per charge. The product spectrum primarily contains singly charged fragments, dominating y-series. The maximal intensity of fragments corresponds to λ ∼ 1 ion/peak/shot, with the vast majority of fragment peaks corresponding to λ ≪ 1. This range of l corresponds to undisputedly correct application of the centroiding method.
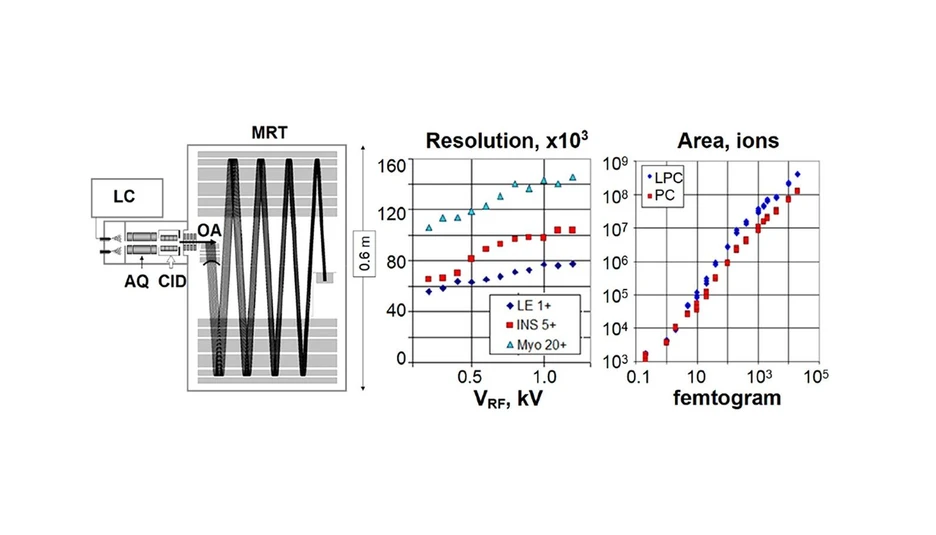
![J. Am. Soc. Mass Spectrom. 2026, 37, 3, 601–611: Figure 3. Resolution of Xevo MRT mass spectrum. (A) MS/MS spectrum of [Glu1]-Fibrinogen peptide B in a wide mass range. (B) Detail spectrum of m/z 741.2 (from A) exhibiting ∼8% intensity of the base peak showing fine isobars, the data comprises a histogram of ∼6900 individual Tof transients corresponding to a total acquisition time of 1 s. (C) Resolution for singly charged fragments vs their m/z. (D) Resolution vs RF amplitude (peak–peak) for ions of various charge states of Leucine Enkephalin LE (z = 1), Insulin INS (z = 6) and Myoglobin Myo (z = 20).](https://lcms.labrulez.com/labrulez-bucket-strapi-h3hsga3/J_Am_Soc_Mass_Spectrom_2026_37_3_601_611_Figure_3_Resolution_of_Xevo_MRT_mass_spectrum_c30c1b3413_l.webp) J. Am. Soc. Mass Spectrom. 2026, 37, 3, 601–611: Figure 3. Resolution of Xevo MRT mass spectrum. (A) MS/MS spectrum of [Glu1]-Fibrinogen peptide B in a wide mass range. (B) Detail spectrum of m/z 741.2 (from A) exhibiting ∼8% intensity of the base peak showing fine isobars, the data comprises a histogram of ∼6900 individual Tof transients corresponding to a total acquisition time of 1 s. (C) Resolution for singly charged fragments vs their m/z. (D) Resolution vs RF amplitude (peak–peak) for ions of various charge states of Leucine Enkephalin LE (z = 1), Insulin INS (z = 6) and Myoglobin Myo (z = 20).
J. Am. Soc. Mass Spectrom. 2026, 37, 3, 601–611: Figure 3. Resolution of Xevo MRT mass spectrum. (A) MS/MS spectrum of [Glu1]-Fibrinogen peptide B in a wide mass range. (B) Detail spectrum of m/z 741.2 (from A) exhibiting ∼8% intensity of the base peak showing fine isobars, the data comprises a histogram of ∼6900 individual Tof transients corresponding to a total acquisition time of 1 s. (C) Resolution for singly charged fragments vs their m/z. (D) Resolution vs RF amplitude (peak–peak) for ions of various charge states of Leucine Enkephalin LE (z = 1), Insulin INS (z = 6) and Myoglobin Myo (z = 20).
Figure 3B shows a 0.1 Th wide region of the MS/MS spectrum to illustrate the separation of close isobaric species, with the b7-NH3 and to the first 13C isotope of b7-H2O fragments at m/z 741.269 and 741.288 Th, spaced 19 mTh apart. The intensity of this ion is ∼8% of the base peak intensity of the GFP spectrum. The data comprises a histogram of ∼6900 individual Tof transients corresponding to a total acquisition time of 1 s. Figure 3C illustrates the resolution of the singly charged fragment ions, which stayed constant around 80K over the complete mass range and dropped marginally at lower m/z end (corresponding to shorter flight times) due to the effect of residual jitters and time spread at 4 GS/s digitization estimated at a 0.15 to 0.2 ns level. The effect is less pronounced compared to benchtop singly reflecting TOF systems because of the longer flight time in o-MRT (125 μs at m/z = 1000).
In Figure 3D, the effect of charge state and RF amplitude in the gas cell on resolution are shown for selected peptides and proteins. Separate infusions of each analyte were completed and mass spectra were acquired over 60 s at 1 Hz MS mode of acquisition for each collision cell RF (V) with the ion beam attenuated to ∼0.1 ions per push to ensure accurate measurement of mass resolution. Mass spectra of monitored charge states for each peptide/protein at 1200 V RF are shown in Supporting Information (Figure S1). Higher RF amplitudes improve the ion beam compression in the CID cell and the compression improves for higher charge states. (29,30) The resolution reaches a maximum of R = 140 k at z = 20, at V-rf = 1200 V p-p at 5 MHz frequency for myoglobin. The effect is explained by a tighter compression of ion beam in the RFG, which reduces the ion beam divergence in the OA, as illustrated in Figure 3D. Simulations presented in Figure 2A explain resolution improvement at smaller ion beam divergences.
Application to LC-MS Lipidomics Analysis
Lipids are an integral part of human biology and represent around a third of all known metabolites. (34) Strongly influenced by endogenous and/or exogenous factors, they are highly regulated through a variety of complex biological processes, including energy storage, cellular signaling and cell–cell interactions. (26) Lipids exhibit themselves in a variety of classes, e.g., fatty acyls, glycerophospholipids, sphingolipids, and occur over a wide dynamic range of 106 or more from nanomolar to attomolar levels. (35)
To demonstrate the applicability of the Xevo MRT for lipidomic analyses, the same plasma lipid extract spiked with varying concentrations of deuterated lipid standards was used here as in the experiment detailed above. The LC-MS data were acquired, peak-picked and database searched accounting for endogenous and the deuterated internal standard components, using waters_connect (Waters Corporation, Wilmslow, U.K.) and Progenesis QI (Waters Corporation, Wilmslow, U.K.) software packages. A representative Total Ion Chromatogram (TIC) is shown in Figure 5A, with eXtracted Ion Chromatograms (XIC) for the 15:0–18:1-d7–15:0 TAG precursor with m/z 829.7 at 10,000 and 0.1 ng/mL provided, shown in Figure 5B,C, respectively, providing a SNR of 10 at 0.1 ng/mL. Representative spectra of the TAG precursor at 10,000 and 0.1 ng/mL are provided as Supporting Figure S4.
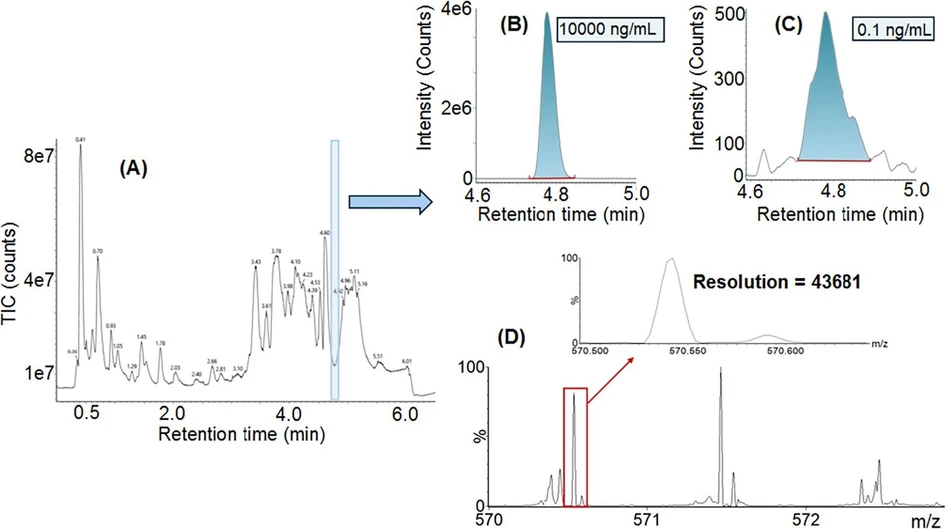 J. Am. Soc. Mass Spectrom. 2026, 37, 3, 601–611: Figure 5. Representative lipidomic example based on the NIST SRM 1950 plasma spiked with EquiSPLASH, showing TIC (A) along with XIC’s of the EquiSPLASH 15:0–18:1(d7)-15:0 TAG at 10,000 (B) and 0.1 ng/mL (C). The fragment ion spectrum for the lowest studied 0.1 ng/mL concentration is shown (D), along with its associated resolution at FWHM in zoom. LC-MS experimental details are provided as Supporting Tables S1 and S2.
Structural elucidation of compounds based on fragment ion data relies strongly on unadulterated or pure peak detections. This is demonstrated with an example m/z 570.54 fragment ion peak corresponding to the TAG internal standard, which is resolved from interfering peaks which could be attributed to coeluting compounds and chemical background as demonstrated in Figure 5D. Even at this lowest analyte level, the fragment ion showed a resolution of 43,681, partially affected by close isobars of the coeluting background. Note that in the absence of mass interferences, the resolution is not affected for small intensity peaks as presented in Figure 3D
Additional identification confidence is provided with the fragment ions being confirmed with a mass tolerance of ±2 ppm following database searching. This level of mass accuracy allows for a significant reduction in false positive identifications. The mass error distributions shown Supporting Figure S5 result in 54% and 42% of the fragment ions being <1 ppm for the 10,000 ng/mL and 0.1 ng/mL levels, respectively.
Identification scores resulting from database searching show only a marginal change over the concentration range, as illustrated by the results shown in Supporting Figure S6. The identification score is a combination of corresponding fragment ions in addition to mass accuracy (precursor and fragment ions) and isotopic fit. At the lowest concentration of 0.1 ng/mL, where chemical noise becomes more apparent, the combination of high mass resolution and mass accuracy increasingly assists with confident compound identification.
Example precursor and product ion spectra of the midlevel concentration spikes from two of the deuterated lipid standards, 18:1-d7 Lyso PC and C15 Ceramide-d7 (d18:1-d7/15:0), respectively, are provided in Supporting Figures S7 and S8.