Seeing is Believing – Detection Made Easy Part 2: Detector Characteristics

KNAUER: Seeing is Believing – Detection Made Easy Part 2: Detector Characteristics
In our previous article, we introduced the main types of detectors used in HPLC. This time, we take a closer look at the performance characteristics of LC detectors and the specifications that should be considered when assessing whether a detector is suitable for a particular chromatographic separation. We will also compare the most common detector technologies and provide some practical guidance for choosing the right option for a specific application.
What Defines an Ideal HPLC Detector?
With such a wide variety of HPLC detectors available, an obvious question arises: why is there no single detector that works for every application? The simple answer is that no detector can satisfy every analytical requirement at the same time. Nevertheless, most detector designs aim to achieve a similar set of desirable properties.
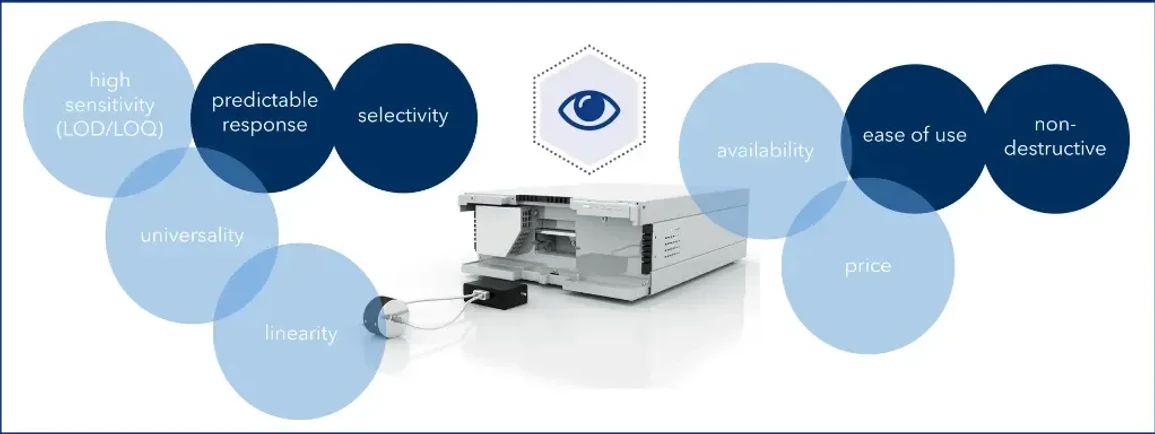 KNAUER: Figure 1 - Detector requirements
1. High Sensitivity – Detecting Very Small Amounts
An ideal detector should be capable of measuring very low quantities of analyte, often in the nanogram or even picogram range. High sensitivity leads to lower limits of detection (LOD), can reduce sample preparation requirements, and is particularly valuable for applications such as impurity analysis or pharmacokinetic studies.
Some detector technologies, including fluorescence detection (FLD), electrochemical detection (ECD), and mass spectrometry (MS), can achieve extremely high sensitivity. However, this level of performance is often limited to specific classes of compounds.
2. Good Selectivity or Broad Applicability – Knowing What Is Being Detected
Selectivity describes how effectively a detector responds to the target analyte while minimizing interference from the sample matrix or mobile phase.
Depending on the analytical task, a detector may need to be highly selective, responding only to compounds with specific characteristics such as fluorescence or electrochemical activity. In other cases, broader applicability may be more important, allowing a wide range of compounds to be detected regardless of their molecular structure.
3. Linear Response and Broad Dynamic Range – Reliable Quantification
A good detector should provide a linear response across a sufficiently wide concentration range. This makes it possible to accurately quantify both major components and trace impurities within the same analytical method.
A broad linear range simplifies calibration and improves confidence in quantitative results. Detector response should also remain highly reproducible from one injection to another.
4. Compatibility with HPLC Conditions – Fitting the Chromatographic Method
An ideal detector should be compatible with both gradient and isocratic elution, commonly used mobile phases and additives, typical flow rates, and standard HPLC operating temperatures.
Poor compatibility may restrict method flexibility or force compromises in chromatographic performance. Some detectors provide excellent analytical performance but only under specific operating conditions, making them less suitable for certain methods.
5. Stability and Low Noise – Distinguishing Signal from Background
A stable baseline with minimal noise and drift improves the signal-to-noise ratio and overall data quality. This becomes especially important in long chromatographic runs, gradient methods, and trace-level analysis.
Lower baseline noise makes weak analyte signals easier to distinguish and directly contributes to improved detection limits.
6. Robustness, Ease of Use, and Maintenance – Supporting Routine Laboratory Work
For day-to-day use, a detector should be reliable over long sequences, straightforward to operate, and require as little maintenance as possible.
In routine laboratories, robustness and ease of operation can be just as important as analytical performance. Simple troubleshooting, low maintenance requirements, and limited consumable costs are major advantages, particularly in high-throughput environments.
The Reality: No Detector Offers Everything
Since no detector fulfils all these requirements perfectly, detector selection is inevitably a compromise between sensitivity, selectivity, universality, robustness, operating flexibility, and cost.
For this reason, multi-detector configurations are increasingly common in modern HPLC systems. Combinations such as UV + CAD or UV + MS make it possible to benefit from complementary detection principles within a single analytical workflow.
| Detector | Principle | Sensitivity | Selectivity | Gradient Compatible | Typical Applications |
|---|---|---|---|---|---|
| UV/VIS | Absorption of light at selected wavelengths | ng – µg | Medium | Yes | Pharmaceuticals, drugs, metabolites |
| Refractive Index (RID) | Change in refractive index of the mobile phase | µg – mg | Non-specific | No | Sugars, alcohols, polymers |
| Fluorescence (FLD) | Excitation followed by light emission | pg – ng | High | Yes | Trace drugs, vitamins, fluorescent compounds |
| Conductivity Detector (CDD) | Measurement of changes in electrical conductivity | µg – mg | Ionic species | Limited | Inorganic ions, salts, electrolytes |
| pH Detector | Measurement of changes in proton concentration | µg – mg | pH-sensitive compounds | Yes | Organic acids/bases, pH monitoring |
| Mass Spectrometry (MS) | Ionization followed by mass-to-charge separation and detection | fg – ng | Very high | Yes | Proteomics, metabolomics, drugs, trace impurities, structural identification |
| Electrochemical Detector (ECD) | Oxidation or reduction at an electrode | pg – ng | Redox-active compounds | Limited | Neurotransmitters, antioxidants, drugs |
| Evaporative Light Scattering (ELSD) | Detection of dried analyte particles by light scattering | ng – µg | Non-volatile compounds | Yes | Sugars, lipids, polymers, non-UV analytes |
| Charged Aerosol Detector (CAD) | Detection of charged analyte particles | ng – µg | Non-volatile compounds | Yes | Sugars, lipids, peptides, polymers |
| Multi-Angle Light Scattering (MALS) | Measurement of scattered light at multiple angles | µg – mg | Molecular size/weight | Yes | Proteins, polymers, nanoparticles |
| Viscosity Detector | Measurement of pressure changes caused by solution viscosity | µg – mg | Polymers, biopolymers | Yes | Molecular size, branching, aggregation |
| Radioactivity Detector | Detection of radioactive decay from labelled analytes | pg – ng | Radioactive isotopes only | Yes | Radiopharmaceuticals, tracers, metabolism studies |
| Chiral Detector | Optical rotation or circular dichroism for distinguishing enantiomers | ng – µg | Enantiomeric selectivity | Yes | Pharmaceuticals, natural products, asymmetric synthesis |
Table 1: Comparison of commonly used HPLC detector classes. (Graphic by KNAUER)
Critical Performance Parameters of HPLC Detectors
Data Sampling Rate
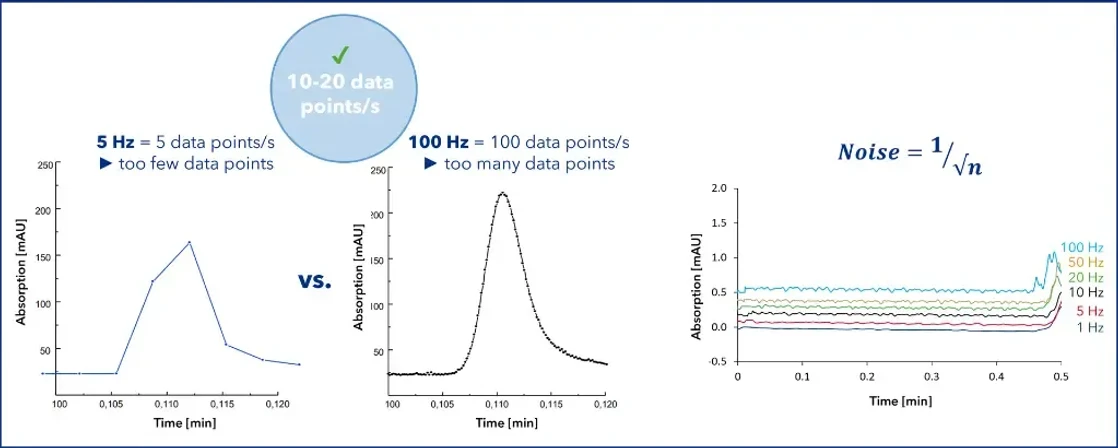 KNAUER: Figure 2 - Example for too less and too high data sampling rate.
The data acquisition rate, also known as the sampling rate, is one of the most important detector settings in HPLC. It describes how many data points are recorded per second and directly influences peak representation, peak shape, area precision, and baseline noise.
The higher the sampling rate, the more data points are collected. The detector processes the measurements collected over a defined time interval and averages them, and these averaged points are then used to construct the chromatogram.
At a data rate of 5 Hz, for example, five data points are acquired every second. If too few points are collected across a chromatographic peak, the resulting peak can appear jagged, poorly defined, and analytically unreliable, as illustrated on the left side of Figure 2.
At the other extreme, a setting such as 100 Hz records 100 points each second, which is often unnecessarily high for conventional HPLC. The optimum sampling rate mainly depends on chromatographic peak width.
For most standard HPLC applications, a data rate of approximately 10 to 20 Hz is sufficient to generate a smooth and symmetrical Gaussian peak.
One consequence of using an excessively high acquisition rate is increased baseline noise. Statistically, the noise of the system depends on the number of data points used for averaging and decreases with the square root of the number of averaged measurements.
Selecting an appropriate sampling rate is therefore a balance between collecting enough points to describe the chromatographic peak accurately and avoiding unnecessary noise.
Noise and Drift
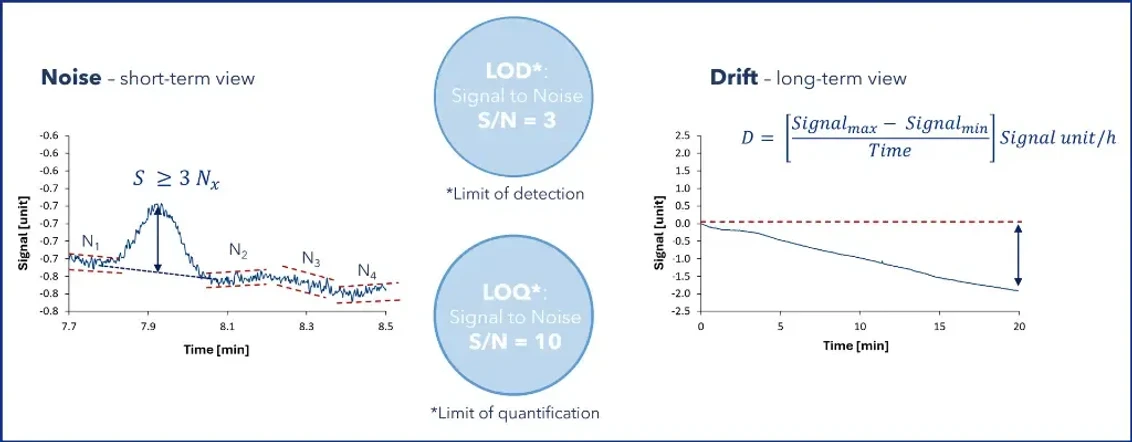 KNAUER: Figure 3 - Baseline noise and drift
What exactly is baseline noise? In simple terms, it represents the short-term fluctuations of the detector baseline over a defined period and is expressed in the units appropriate for the particular detector.
Baseline noise is typically determined from the peak-to-peak variation of the detector signal while the mobile phase passes through the system.
All HPLC detectors exhibit a certain level of noise. Potential sources include:
- electronic noise,
- detector cell noise,
- detector instability,
- temperature fluctuations,
- mobile-phase effects,
- and other environmental or instrumental influences.
Noise directly affects detector sensitivity because it determines the signal-to-noise ratio (S/N).
A chromatographic peak is generally considered reliably detectable when its height is at least three times greater than the calculated baseline noise. This relationship is commonly used to define the limit of detection (LOD).
The limit of quantification (LOQ) requires a stronger signal and is typically defined as approximately ten times the baseline noise.
Another important parameter affecting sensitivity is baseline drift. Drift reflects the gradual change in detector response over time and therefore provides useful information about long-term detector stability.
It is helpful to distinguish between short-term peak-to-peak noise and longer-term baseline drift over a defined time interval. Drift can be described as the average slope or change of the baseline within a specific period.
Excessive drift may reduce sensitivity and complicate chromatographic peak integration.
Short-term baseline instability can be influenced by contamination or deterioration of detector components, while long-term drift is often related to temperature stability, detector equilibration, or changes occurring within the analytical system.
How to Select the Right HPLC Detector
There is no universally “best” HPLC detector. The correct detector is simply the one that best matches the analytical task.
When selecting a detector, several practical questions can help narrow the choice.
1. Does the analyte absorb UV light or fluoresce?
If the answer is yes, optical detectors such as UV/VIS or FLD are often the simplest and most effective options.
UV/VIS detection is widely applicable to compounds containing suitable chromophores, while fluorescence detection provides particularly high sensitivity and selectivity for naturally fluorescent or derivatized analytes.
2. Does the analyte lack a chromophore?
If UV absorption is weak or absent, detectors such as RID, ELSD, or CAD may provide a more appropriate solution.
These detector types are useful for compounds such as sugars, lipids, polymers, and other analytes that are difficult to monitor by conventional UV detection.
3. Is structural information required?
If structural information is important, mass spectrometry is usually the strongest choice.
MS provides mass-to-charge information and, when tandem mass spectrometry is used, fragmentation data that can support compound identification and structural characterization.
4. Is extremely high sensitivity necessary?
For applications requiring very low detection limits, electrochemical detection or mass spectrometry may be the most suitable options.
The exact choice depends on the chemical properties of the analyte and the required degree of selectivity.
5. Are macromolecules such as proteins or polymers being investigated?
For characterization of macromolecules, MALS and viscometry can provide valuable information about molecular weight, molecular size, branching, and aggregation.
These techniques are especially powerful when combined with size-exclusion chromatography and can provide information that is not based solely on column elution behavior.
For a more detailed discussion of detector selection, see the KNAUER blog article “The way you look at it – A comprehensive guide for selecting the appropriate HPLC detector.”
Choosing the detection technology based on analyte properties, required sensitivity, chromatographic conditions, and the type of information needed is essential for obtaining reliable and meaningful HPLC results.
Final Thoughts
Understanding the desired characteristics and key performance parameters of HPLC detectors helps explain why different detector technologies are suited to different applications.
No single detector can provide maximum sensitivity, selectivity, universality, robustness, flexibility, and low operating cost simultaneously. Recognizing these trade-offs provides a practical framework for selecting the most appropriate detector for a given chromatographic method.
Parameters such as data sampling rate, baseline noise, drift, dynamic range, and compatibility with chromatographic conditions are just as important as the underlying detection principle itself.
In the next articles of this series, we will take a closer look at the individual HPLC detection technologies, beginning with the most widely used optical detection method: UV/VIS detection.
- L. R. Snyder, J. J. Kirkland, J. W. Dolan, Introduction to Modern Liquid Chromatography, 3rd Edition, John Wiley & Sons, Inc., Hoboken, New Jersey, 2010.
- D. A. Skoog, F. J. Holler, S. R. Crouch, Principles of Instrumental Analysis, 7th Edition, Cengage Learning, Boston, 2018.
- R. P. W. Scott, Liquid Chromatography Detectors. In J. Chromatogr. Library, Vol. 11, Elsevier Scientific Publishing Company, Amsterdam, 1977, pp. iii-ix, 1-248.
- V. R. Meyer, Praxis der Hochleistungs-Flüssigchromatographie, 10., vollst. überarb. u. erw. Auflage, Wiley-VCH, Weinheim, 2009.
- G. Aced, H. J. Möckel, Liquidchromatographie, Apparative, theoretische und methodische Grundlagen der HPLC, VCH Verlagsgesellschaft mbH, Weinheim, 1991.