Soft Independent Modeling of Class Analogies for the Screening of New Psychoactive Substances through UPLC-HRMS/MS
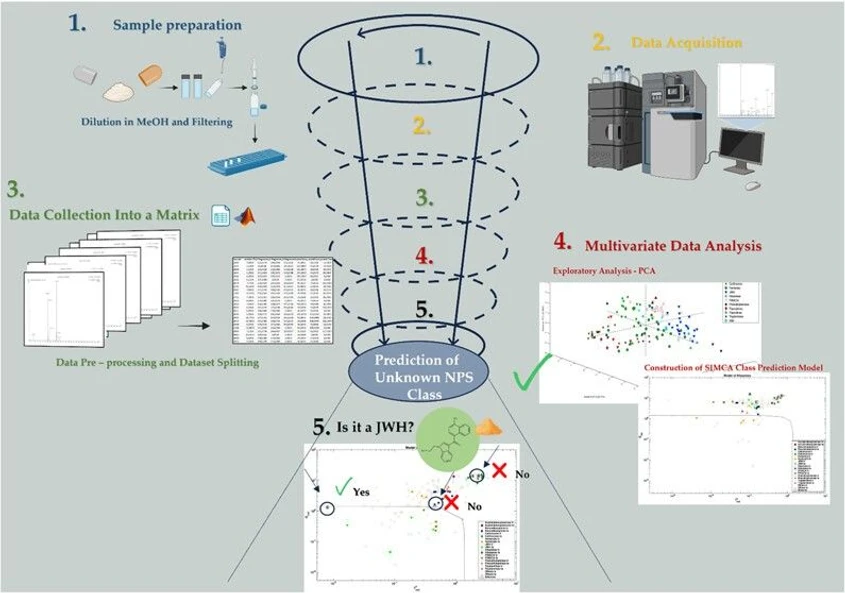
Anal. Chem. 2025, 97, 28, 15420–15429: Graphical abstract
The rapid spread of new psychoactive substances (NPS) presents global challenges due to their unpredictable effects and ability to evade routine drug tests. This study applied UPLC-HRMS combined with multivariate analysis to classify and identify unknown NPS.
A dataset of 159 standards was processed for PCA and SIMCA modeling, showing clear clustering for several NPS classes. The validated SIMCA models successfully classified test analytes and seized drug samples, particularly at lower collision energies. Despite some misclassifications caused by limited standards, the models proved highly effective, highlighting their value for forensic screening of NPS.
The original article
Soft Independent Modeling of Class Analogies for the Screening of New Psychoactive Substances through UPLC-HRMS/MS
Ilenia Bracaglia, Sara Gamberoni, Camilla Montesano*, Francesco Bartolini, Sabino Napoletano, Claudio D’Alfonso, Chiara Nieri, Federico Marini, Manuel Sergi
Anal. Chem. 2025, 97, 28, 15420–15429
https://doi.org/10.1021/acs.analchem.5c02450
licensed under CC-BY 4.0
Selected sections from the article follow. Formats and hyperlinks were adapted from the original.
The detection and analytical recognition of New Psychoactive Substances (NPS) represents a current challenge in forensic drug analysis. The spread of these substances has become a global phenomenon, involving more than 800 different compounds, as reported by the United Nations Office on Drugs and Crime (UNODC) through its Early Warning Advisory (EWA). (1) NPS are defined “substances of abuse, either in a pure form or a preparation, that are not controlled by the 1961 Single Convention on Narcotic Drugs or the 1971 Convention on Psychotropic Substances, but which may pose a public health threat”. (2) The development and production of NPS began decades ago with the aim of creating pharmacologically active compounds that could replicate the effects of the main categories of internationally controlled psychotropic drugs. (3) Many of these drugs share common chemical structural features with controlled substances, often differing by only a slight modification of the original molecule. (4) As a result, the detection and analytical identification of unknown NPS is difficult, since their rapid spread often exceeds existing analytical protocols, and is further complicated by the lack of reference standards. (5)
When dealing with drug seizures, typically an initial qualitative analysis using low cost, portable instruments is carried out; these may identify the characteristic chemical groups of the substances but have low selectivity and specificity. (6) More sophisticated techniques including nuclear magnetic resonance (NMR), gas chromatography–mass spectrometry (GC-MS), liquid chromatography tandem mass spectrometry (LC-MS/MS) (7,8) and especially high-resolution mass spectrometry (HRMS) are then crucial for the identification of unexpected drugs.
At present HRMS is the gold standard for NPS detection, given its ability to record accurate mass measurements that provide information about molecular structures; (3) but the complexity of data obtained limits its routinary application. For this reason, it is necessary to combine top-down and bottom-up approaches (5,9) to interpret and simplify data with additional support from databases (such as HighResNPS, (10) SWGDRUG, (11) mzCloud) and data mining tools for retrospective analysis. (7,8,12,13) An analytical approach for identifying both known and unpredicted NPS could involve the analysis of diagnostic fragment ions characteristic of each NPS core. This methodology can be particularly useful for preliminary MS screening, especially when comparative confirmation with analytical reference standards is unavailable. (14−16) Vincenti et al. (17) employed a molecular networking strategy to group similar compounds or those sharing the same m/z into clusters based on the similarity of their MS/MS fragments. This approach facilitated the identification of similarities among MS/MS spectra within a data set and enabled the correlation of unknown but related molecules. Ventura et al. (18) exploited DART-HRMS technology to observe neutral losses typical of the tryptamine class and employed Hierarchical Cluster Analysis (HCA) (19) for data analysis; the observed clusters were then used to create a supervised classification model (partial least-squares discriminant analysis, or PLS-DA) to support the identification of unknown tryptamine structures. Other classification models have been used to identify the structural characteristics of illicit drugs from MS, (20,21) chromatographic (22) or IR data, (23−25) however, they have never been applied to putatively identify new drugs.
The present study combined analytical and chemometric tools to detect unknown NPS in seizures through UPLC-QTOF-MS analysis. The preliminary step consisted in analyzing 159 NPS standards to obtain chromatographic and MS/MS information. A data matrix, including m/z of precursor and fragments, retention time, and neutral losses, was then built and was split into training and test sets. Principal component analysis (PCA) (16,26) was then applied to explore the data, while a class modeling strategy based on Soft Independent Modeling of Class Analogies (SIMCA) (20,27,28) was employed to create robust models aimed at predicting the class of unknown NPS. The models were validated on the test set and with real seized samples obtained from the Scientific Police Service.
Experimental Section
UPLC-MS/MS Analysis
Data acquisition was performed using an UPLC-QTOF system consisting of an ACQUITY I-Class UPLC System coupled to a SYNAPT G2-Si HDMS (Waters Corporation, Milford, MA). Instrument control, data acquisition, and initial data processing were performed with MassLynxTM version 4.2. Chromatographic separation was achieved using a C18 column (ACQUITY UPLC HSS C18 Column, 100 Å, 1.8 μm, 2.1 150 mm) maintained at 50 °C with a flow rate of 0.4 mL min–1; injection volume was 10 μL. The mobile phases were 5 mM ammonium formate buffer, pH 3.0 (A), and acetonitrile 0.1% HCOOH (B). The chromatographic separation was performed with the following gradient: phase B was held at 13% in the first 0.5 min, then increased linearly to 50% in 10 min. Then, phase B was rapidly changed to 95% in 0.75 min and held for 1.5 min. After 0.25 min, the column was returned to the original ratio within 4 min. The total run time was 16.5 min.
The TOF-MS was operated in positive electrospray ionization mode (Z-SprayTM, Waters) with the following settings: 800 L/h of nitrogen as the nebulization gas at 500 °C, 40 L/h cone gas flow at 120 °C, a capillary voltage of 3 kV and argon as the collision gas. Data were recorded in profile mode using Full Scan and then MS/MS mode. These scans were carried out in Resolution mode (fwhm 20,000) with a mass range from 50 to 700 Da. MS/MS spectra were acquired with CE ramped from 10 to 30 V, with a scan time of 1 s for each time window centered on the retention time of each analyte ± 30 s (see Table S1). Mass calibration was performed daily with the Major Mix.
Result and Discussion
Data Matrix Building
The analytical standards were selected based on the substances most frequently reported by the UNODC Early Warning Advisory (EWA), the first global monitoring system for NPS. (32) In this context, the classes with the largest number of substances chosen are synthetic cathinones, synthetic cannabinoids, and synthetic opioids, which mainly include fentanyl analogues. (33,34)
To achieve optimal chromatographic separation and maximize MS spectral response, the chromatographic column, mobile phases, and gradient were carefully selected and tailored, considering the nature of the analytes under examination. The choice of the column and mobile phases was supported by extensive literature studies (35−37) and experimental testing.
Full Scan and MS/MS acquisition modes were chosen to obtain fragmentation spectra for the analytes under study. The Full Scan analysis of the 159 NPS enabled the determination of characteristic retention times for these substances, allowing for simultaneous gradient adjustments to separate isomeric compounds, such as Ethcathinone, Dimethylcathinone, and 3-Methylmethcathinone, eluting at 1.86, 1.93, and 3.05 min, respectively, as well as α-methyl fentanyl and cis-3-methyl fentanyl eluting at 5.41 and 6.64 min, respectively.
Subsequently, MS/MS analysis was performed to obtain specific fragmentation patterns for each analyte, testing two collision energy ramps: 10–30 and 30–50 V. To this aim, the chromatographic run was divided into distinct acquisition time windows of approximately ± 0.7 min. This approach allowed efficient and targeted fragmentation data acquisition across all analytes within the optimized timeframes.
By analyzing the obtained spectra (some examples are shown in Figure 2), it was possible to identify and consider the most intense fragments characteristic of each analyte and compare them with the Waters Forensic Toxicology Library and HighResNPS. (11) Moreover, the neutral losses were calculated by examining the differences between the signal corresponding to the fragments, ranked in descending order of intensity and above a relative intensity threshold of 10%, and the base peak. This approach provided valuable information about the structure of the compounds, facilitating a deeper understanding of their chemical properties.
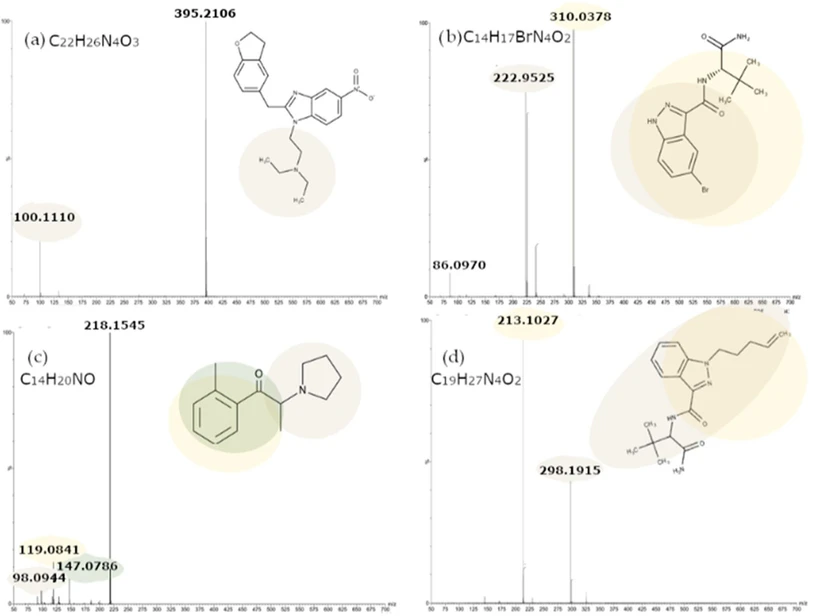 Anal. Chem. 2025, 97, 28, 15420–15429: Figure 2. MS/MS spectra (CE ramp of 10–30 V) for: (a) ethylenoxynitazene; (b) ADB-5Br-INACA; (c) 2-Methyl-α-PHP; (d) ADB-4en-PINACA(+H+).
Data Treatment and Multivariate Data Analysis Strategies
All MS/MS spectral data acquired from the 159 NPS standards, including precursor m/z, the m/z values of the three most intense fragments, and the three corresponding neutral losses, were organized within two matrices, the first containing MS/MS spectra acquired in the CE range of 10–30 V (159 × 8), and the second containing MS/MS spectra acquired in the CE range of 30–50 V (142 × 8). These matrices also include chromatographic information such as retention time, which is a characteristic parameter influenced by the physicochemical properties, although it also depends on the chromatographic conditions used.
The preliminary PCA conducted on the training set (122 substances) of the data acquired in the CE range of 10–30 V (Figure 3a,b) already highlighted some well-defined clusters corresponding to specific classes of substances. Only the results of PCA on this matrix are presented, as the exploratory analysis performed on the matrix derived from data acquired in the CE range of 30–50 V did not show any clear groupings.
 Anal. Chem. 2025, 97, 28, 15420–15429: Figure 3. (a, b) Scores and loadings plot of the PCA calculated on the training set including all compound classes; (c, d) Scores and loadings plot of the PCA calculated on the Training set including only the nine most represented classes.
Following the graphical exploration of the data, we further subdivided the synthetic cannabinoid and synthetic opioid classes into the following respective subclasses: JWH, PINACA, WIN, SC1, SC2, and SC3 (synthetic cannabinoids), fentanyls and nitazenes (synthetic opioids). A graphical representation of the defined subclasses is shown in Figure 4, highlighting the common chemical groups.
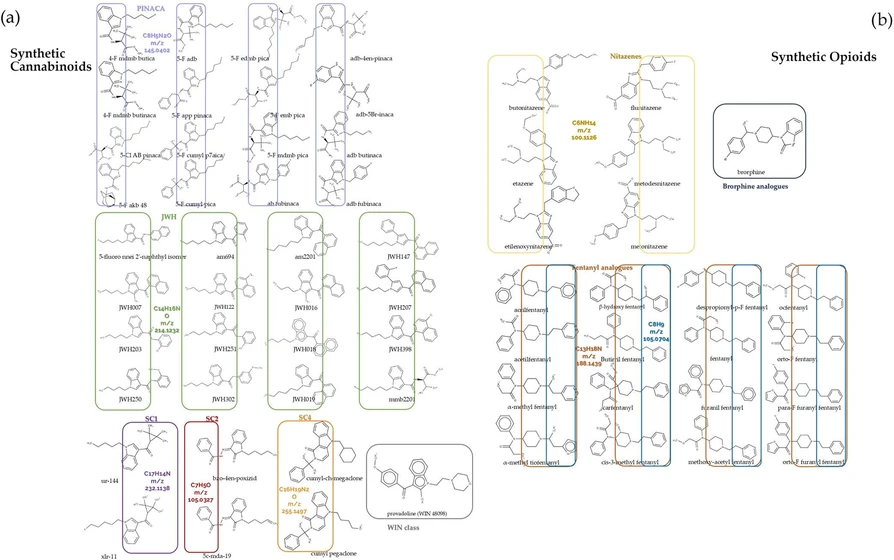 Anal. Chem. 2025, 97, 28, 15420–15429: Figure 4. Defined subclasses within (a) synthetic cannabinoids (JWH-green, PINACA-violet, WIN-gray, SC1-purple, SC2-red, SC3-orange) and (b) synthetic opioids (brorphine analogues-blue, nitazenes-yellow, and fentanyl analogues-dark orange and blue).
Conclusions
The proposed approach integrates advanced analytical strategies based on UPLC-HRMS technologies with multivariate analysis to monitor the rapid emergence of NPS. The supervised SIMCA approach proved effective in correctly identifying the class of various compounds, even in real contexts, as highlighted by the analysis of real samples. External validation conducted on three real samples confirmed the models’ ability to generalize and adapt to data not included in the training set, reducing the risk of overfitting and demonstrating strong predictive performance, as evidenced by the positive validation parameters obtained for each model.
Despite the overall positive results, some cases of misclassification emerged. An example concerns the tryptamine model, which showed relatively low specificity, leading to false positives attributable to the scarcity of available standards in this class, thereby limiting the model’s robustness.
To further improve performance and minimize classification errors, continuous model updates are essential, including a greater number of analytes for each class. In parallel, increasing the number of descriptive variables in the data set could enhance the model’s ability to more precisely differentiate analytes based on their physicochemical similarities.
A key advantage of the SIMCA approach lies in its flexibility. Unlike other techniques, such as PLS-DA, which attempt to model all classes within a single model and require known samples, SIMCA constructs separate models for each class. This feature eliminates the need for samples from nontarget classes, allowing the possibility of not classifying samples into any of the modeled categories. This multivariate approach proves particularly useful for classifying unknown NPS structurally related to those already known identifying potential new classes and recognizing metabolites, paving the way for future applications in analyzing biological matrices. This capability represents an added value in the context of NPS monitoring, increasing the knowledge of this constantly evolving phenomenon and providing strong support for forensic investigations. In addition, the approach described can be valuable in other fields, such as doping analysis, metabolomics, and environmental analysis.