Regarding Emitter Positioning for Nanoflow Electrospray Ionization with a High-Capacity Inlet Capillary
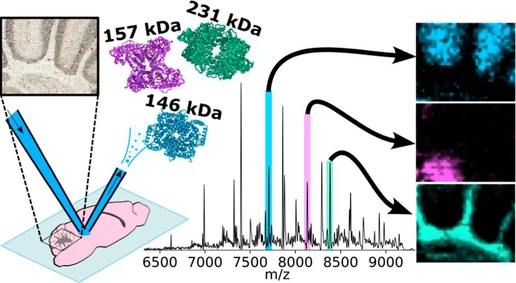
J. Am. Soc. Mass Spectrom. 2026, 37, 3, 754–759: Graphical abstract
This study investigates the impact of emitter positioning on signal intensity in nanoflow electrospray ionization mass spectrometry. By systematically varying emitter position in three dimensions, the authors demonstrate that signal robustness improves at greater distances along the z-axis, with consistent performance maintained within 1–2 mm of the optimal position.
Signal behavior was consistent across the m/z range, indicating that precise repositioning for different analytes is unnecessary. These findings provide practical guidance for improving robustness and reproducibility in nanoflow LC–MS/MS proteomics workflows.
The original article
Regarding Emitter Positioning for Nanoflow Electrospray Ionization with a High-Capacity Inlet Capillary
Noah M. Lancaster, Scott T. Quarmby, Katherine A. Overmyer, and Joshua J. Coon*
J. Am. Soc. Mass Spectrom. 2026, 37, 3, 754–759
https://doi.org/10.1021/jasms.5c00441
licensed under CC-BY 4.0
Selected sections from the article follow. Formats and hyperlinks were adapted from the original.
Owing to its high sensitivity, nanoflow electrospray liquid chromatography coupled with tandem mass spectrometry (nESI-LC-MS/MS) is widely used for protein sequence analysis. (1,2) Whereas high-flow electrospray sources typically have relatively fixed emitter alignments and are more robust to changes in emitter positioning, nESI sources frequently require manual alignment in three dimensions. (3,4) Since the number of ions reaching the MS system can vary depending on the location of the nESI emitter, positioning is a critical aspect of achieving robust and reproducible results.
Multiple reports illustrate the relationship between emitter positioning and electrospray signal intensity; (2,4−10) however, these studies typically examine a single dimension or evaluate emitters and flow regimes not typical of shotgun proteomic workflows. To understand these relationships, we investigate here the effect of emitter positioning on signal intensity when using fused-silica capillaries with integrated emitters at a flow rate of 300 nL/min, a common choice across the field. (11−17) Experiments were conducted using an Orbitrap Ascend mass spectrometer, a notable example of instruments commonly used in proteome analysis, (18) which features a nanoflow source and asymmetric inlet capillary (high-capacity transfer tube, HCTT). This work represents, to our knowledge, the first report in the literature characterizing how emitter positioning impacts signal intensity for nanoflow electrospray ionization into an inlet capillary without radial symmetry.
Since most nESI emitters are manually positioned, understanding the precision in positioning that is required could assist in reducing batch-to-batch variation that is common in larger proteomic experiments. Further, recent efforts to improve the throughput of proteome analysis feature the use of multiple columns with multiple emitters aligned with the source at the same time. (19−23) By performing measurements in all three dimensions, this report provides insight for implementing such a multiemitter setup.
Experimental Section
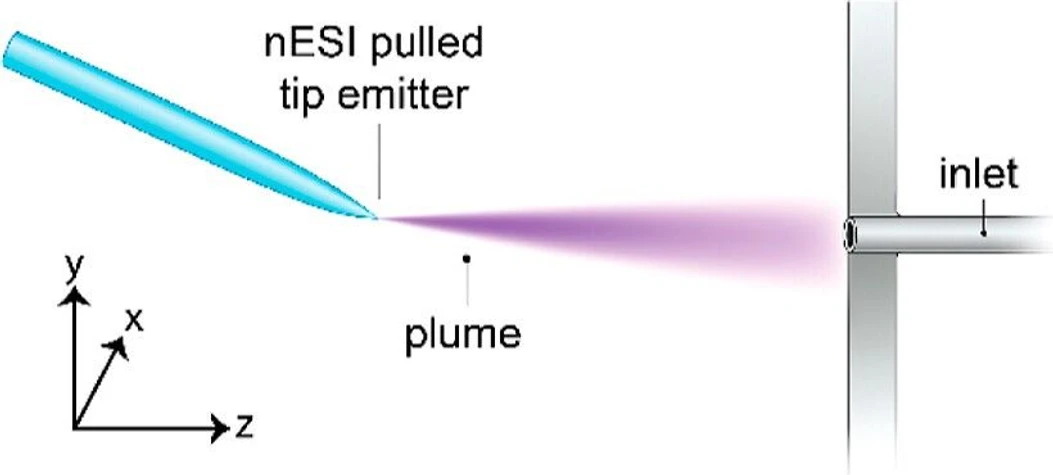
Emitter positioning measurements were performed by infusing BSA peptides at 300 nL/min into an Orbitrap Ascend mass spectrometer (Thermo Scientific) using a fused silica capillary (360 μm O.D, 75 μm I.D.) with integrated emitter (∼10 μm opening). (24) The emitter was aligned to the inlet using the source camera and the x/y/z micrometer on a NanoSpray Flex source (Thermo Scientific). The origin of the coordinate system used here was defined as the center of the inlet capillary opening. In particular, the z = 0 plane is orthogonal to the opening of the inlet capillary, and the x = 0 and y = 0 planes are parallel to the inlet capillary axis. Top- and side-view images of the starting position are shown in Figure S2. Code used for data analysis is available at https://github.com/coongroup/EmitterPositioning. Raw data is available at MassIVE accession number MSV000100165. Additional experimental and data analysis details are described in the Supporting Information.
Results and Discussion
We characterized signal intensity dependence on emitter position for nanoflow electrospray by infusing a mixture of peptides generated via trypsin digestion of purified BSA in an Orbitrap-quadrupole linear ion trap hybrid mass spectrometer (Orbitrap Ascend Tribrid). To ensure LC–MS applicability, we used an emitter size (∼10 μm orifice) and flow rate (300 nL/min) identical to those typical of capillary LC–MS. (11−17) The resulting MS1 analysis produced numerous ions across the m/z range (Figure S3). We selected two of these ions, a doubly protonated species (LGEYGFQNALIVR at m/z 740.4) and a triply protonated species (RHPEYAVSVLLR at m/z 480.6), for their strong signal intensity and stability over the time range of the experiments here (Figures S4 and S5). With the above setup, we tracked those m/z peaks as a function of emitter position in three dimensions and recorded intensity distributions (Figure 1). Figure 1C presents the ion signal across x-positions, where the x = 0 plane is aligned to the central axis of the inlet capillary and the dashed lines depict the MS inlet opening width in this dimension (0.6 mm, Figure S6). (25,26) Strikingly, we observe that the signal is relatively stable and high across two millimeters of the x-dimension. Further, greater than 50% of the ion signal is retained at distances up to ∼five times the width of the inlet (i.e., full width half max (fwhm)). Figure 1D presents the same concept but in the y-dimension, where good signal stability is also observed across a similar length of two millimeters; however, the larger inlet opening in the y-dimension (1.6 mm) does not appear to proportionally impact the width of the intensity distribution. The ion plume is roughly symmetrical in both x- and y-dimensions; (8) therefore, it is expected that the smaller inlet width in the x-dimension would have a higher probability of being in the high density region of the plume than in the y-dimension. Proportional to inlet opening, the x position of the emitter would consequently have less of an effect on the intensity than the y position. We note the intensity distributions appear to be slightly off-center; however, we find the centroids of the distributions (−0.1 and 0.3 mm, x- and y-respectively, Figure S7) were within the tolerance of the micrometer. Figure 1E presents the ion intensities as a function of emitter position in the z-dimension. Impressively, signal continues to be observed up to ∼7 mm removed from the inlet at levels close to 50% of the highest. Not surprisingly, the highest signal is observed at the closest position, but, as noted above, that signal gradually declines with increasing distance. The relative intensities of these two peptide ions remain fairly constant at all observed z positions (Figure S8). Overall, identical trends were observed for both peptides over all dimensions. As these peptides are fairly high signal intensity, we wanted to confirm that the trends reported here were not biased by signal saturation, so we extracted signal intensities for low intensity features and compared the x, y, and z intensity distributions (Figure S9). This analysis confirms that these two peptides are representative of global trends for our tryptic peptide sample.
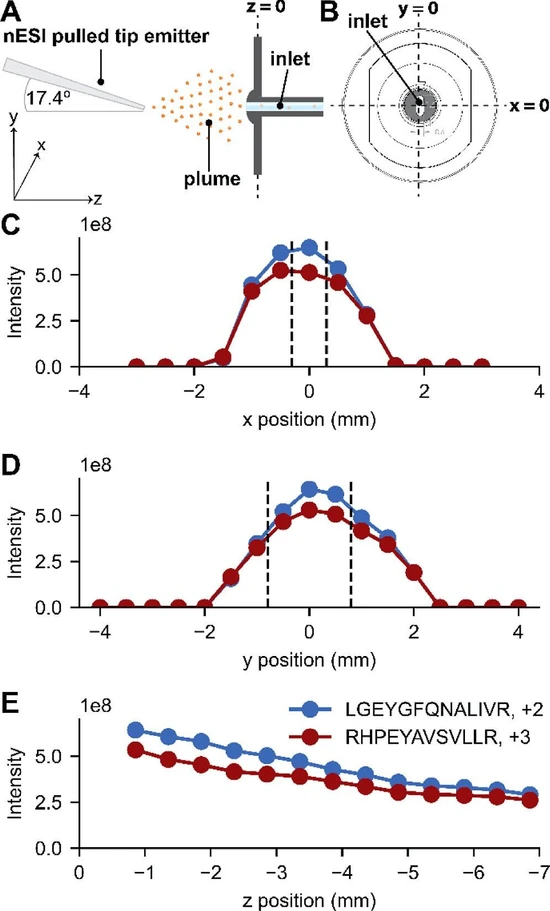 J. Am. Soc. Mass Spectrom. 2026, 37, 3, 754–759: Figure 1. 1D Positioning Experiments. (A) The x/y/z coordinate system used for this study. (B) An x/y perspective of the inlet with coordinate definitions. (C) Intensity dependence on x-position for two selected peptides (at y = 0 and z = −0.9). Dotted lines indicate the estimated position of the inlet capillary edges. (D) Intensity dependence on y-position for two selected peptides (at x = 0 and z = −0.9). Dotted lines indicate the estimated position of the inlet capillary edges. (E) Intensity dependence on z-position for two selected peptides (at x = 0 and y = 0).
Conclusions
We report the dependence of peptide signal intensity on emitter positioning for nanoflow electrospray. Specifically, within 1–2 mm in any dimension, one can achieve reasonably consistent and robust signal. Distinct intensity profiles we observed here for the x- and y-dimensions likely arise from the asymmetric shape of the ion capillary. We demonstrate improved robustness of signal intensity to x/y variation at increasing z distances, an observation that will be helpful for positioning multiple emitters, for example. (19−23)
We provide evidence that the effect of the emitter position on signal intensity does not strongly depend on the analyte for bottom-up proteomics analysis. This report provides insight into the role of emitter positioning on signal intensity for bottom-up proteomics and represents the first characterization of the effect of emitter position on electrospray signal intensity on an instrument with an inlet capillary lacking radial symmetry. Future areas of interest would be an examination of how trends vary across different flow rates or emitter types, as well as assessing how the exact intensity profiles vary across instruments with differences in their atmospheric interface.