Benchmarking Lysosome Enrichment Methods: A Guide for Research and Clinical Translation
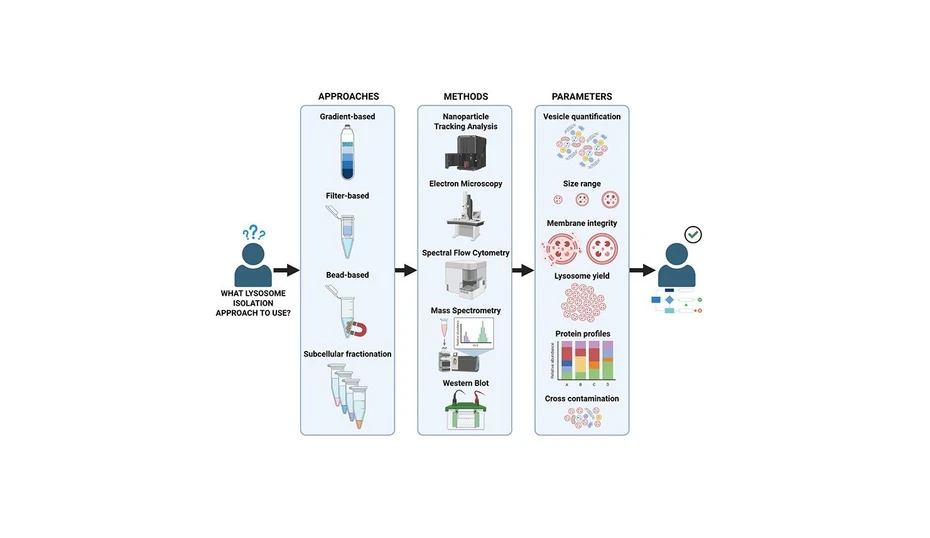
Anal. Chem. 2026, 98, 6, 4585–4600: Graphical abstract
This study systematically compares four widely used lysosome enrichment strategies, including density gradient separation, magnetic bead isolation, filter-based enrichment, and subcellular fractionation. Using the THP-1 monocytic cell line, the methods were evaluated for lysosome yield, purity, membrane integrity, reproducibility, scalability, and contamination through complementary analytical techniques and proteomics.
The results showed that gradient- and bead-based methods achieved the highest lysosomal purity, while subcellular fractionation yielded larger numbers of lysosomes but with greater contamination and variability. Filter-based enrichment enabled rapid processing but recovered mainly nonintact lysosomes. The findings provide practical guidance for selecting lysosome isolation methods in both research and clinical applications.
The original article
Benchmarking Lysosome Enrichment Methods: A Guide for Research and Clinical Translation
Anniek L. de Jager, Sara Kassem, Louis Alesha, Brigitta A.E. Naber, Inge F. de Laat, Bas de Mooij, Kyra van der Pan, Erik Bos, Roman I. Koning, Jacques J.M. van Dongen*, Cristina Teodosio*, and Paula Díez*
Anal. Chem. 2026, 98, 6, 4585–4600
https://doi.org/10.1021/acs.analchem.5c05792
licensed under CC-BY 4.0
Selected sections from the article follow. Formats and hyperlinks were adapted from the original.
Since their discovery by De Duve et al. (1) in 1955, lysosomes have emerged as dynamic organelles critical to cellular homeostasis, regulating processes from nutrient sensing to plasma membrane repair. (2−5) These acidic, enzyme-packed vesicles (6,7) are now acknowledged as central players in pathologies far beyond their classical association with lysosomal storage disorders (LSDs). Dysfunctional lysosomes are involved in neurodegenerative diseases (e.g., Alzheimer’s, Parkinson’s), (8−10) cancer metastasis, (11−13) and cardiovascular disorders. (14,15) At the same time, lysosomal proteins like GBA1 and LAMP2 serve as biomarkers and therapeutic targets. (16−19) Despite their clinical significance, a major challenge in lysosomal research persists since lysosomes constitute less than 5% of cellular volume, (20,21) requiring precise enrichment for accurate analysis in diagnostic and therapeutic development. (22,23)
Current lysosome isolation methods, including density gradient-based separation, (24−28) filter-based size exclusion approaches, (29) magnetic particle phagocytosis, (30−33) subcellular fractionation (SCF), (34) and immunoprecipitation strategies, (35,36) vary widely in yield, purity, structural integrity, and practicality. For instance, density gradient-based methods, which often use Percoll (37) or sucrose, (38) while well-established, user-friendly, and cost-effective, coisolate organelles with similar densities, such as endosomes, peroxisomes, and mitochondria, (39,40) and can be time-consuming, potentially affecting lysosomal protein integrity. Conversely, filter-based size exclusion methods isolate lysosomes based on their size, (29) offering shorter processing times and straightforward protocols. Nevertheless, these approaches may result in cross-contamination, as various cellular vesicles share similar sizes. (20,21) Magnetic bead-based methods (e.g., superparamagnetic iron oxide nanoparticles, SPION) involve the endocytic uptake of magnetic beads, (35,41) offering specificity but altering lysosomal physiology through forced phagocytosis, which hampers functional assays, such as in cancer drug screening. (42,43) Finally, SCF, which employs sequential lysis steps to enrich specific organelles, including lysosomes, (34,44) is a rapid, easy-to-use, and cost-effective method; however, significant cross-contamination is linked to this method. (34,44) Such trade-offs are rarely addressed in single-modality studies, leaving clinicians and researchers without clear guidance for protocol selection. This gap is particularly critical in translational contexts, where diagnostic laboratories that prioritize high-purity lysosomes for biomarker discovery require protocols different from those of therapeutic teams that need lysosomes for drug efficacy testing.
Previous comparative studies, such as the proteomic analysis by Singh et al., (35) have provided valuable insights but primarily focused on yield and purity assessments via proteomic markers, overlooking several key parameters with potentially relevant impacts in translational and clinical applications. Critically, these studies often omit functional and practical metrics: for instance, they typically do not evaluate lysosomal membrane integrity, which is vital for enzyme activity and therapeutic testing, nor do they consider the scalability and feasibility of protocols for contexts where only limited patient samples are available or the potential presence of isolation artifacts. This omission of practical, multimodal assessment represents a critical gap that prevents researchers from selecting a protocol optimized for specific clinical goals.
Our study seeks to address these limitations by employing a multimodal framework that evaluates four widely used lysosome isolation methods across several metrics that are critical for clinical applications. We systematically assessed the yield and reproducibility of each method, factors that are essential for biobanking and high-throughput diagnostic workflows. We also examined organelle purity, crucial for avoiding false positives in proteomic biomarker screenings, together with lysosomal membrane integrity, an important consideration for functional studies and drug testing. Finally, we considered the scalability of each method, ensuring that our findings are relevant for studies involving rare or precious patient-derived cells together with the cost and processing time of each technique. Thus, by integrating nanoparticle tracking analysis (NTA), spectral flow cytometry, transmission electron microscopy (TEM), and mass spectrometry (MS)-based proteomics, our study revealed distinct advantages for each method depending on the intended application. With this comprehensive benchmark, we bridged a critical gap between fundamental lysosome biology and clinical implementation, guiding researchers and clinicians in the selection of the most appropriate isolation strategies tailored to their diagnostic or therapeutic goals.
Experimental Section
Liquid Chromatography–Tandem Mass Spectrometry Analysis (LC–MS/MS)
For liquid chromatography–tandem mass spectrometry (LC–MS/MS) studies, a total of 15 μg of proteins were reduced with 10 mM DTT at 45 °C for 30 min, followed by alkylation with 40 mM 2-iodoacetamide (IAA, Sigma-Aldrich) at RT for 30 min. This last reaction was quenched with 20 mM DTT, and protein digestion and peptide recovery were performed using hydrophilic and hydrophobic beads (Sera-Mag Carboxylate-Modified Magnetic Particles, Cytiva, Marlborough, MA/USA) according to the Single-Pot Solid-Phase-enhanced Sample Preparation (SP3) method. (46,47) In short, samples were incubated twice with beads (1:10 (w/w) protein:bead ratio) in 70% acetonitrile (ACN) for 18 min at RT. After incubation, bead-bound proteins were retained by using a DynaMag-PCR Magnet (Thermo Fisher), and contaminants were washed away three times with 80% ethanol (Sigma-Aldrich). Proteins were digested using a Trypsin/LysC mix (1:25 (w/w) enzyme:protein ratio, Promega, Madison, WI/USA) in 50 mM ammonium bicarbonate at RT overnight. Beads were then washed twice with ACN, after which peptides were eluted in 2% (v/v) dimethyl sulfoxide (DMSO, Thermo Fisher), lyophilized in a freeze-dryer, and stored at −20 °C. Samples were then tagged using the tandem mass tag (TMT) labeling kit (TMTpro 16plex tags, Thermo Fisher) by resuspending the lyophilized peptides in 40 mM HEPES pH 8.4 and labeling with the TMT tags at a 1:5 (w/w) sample:tag ratio for 1 h at RT. The labeling reaction was quenched with 5% hydroxylamine. TMT-labeled lysosome samples were pooled, lyophilized in a freeze-dryer, and stored at −20 °C until LC–MS/MS analysis.
Mass Spectrometry Data Acquisition and Analysis
MT-labeled peptides were dissolved in solvent A (water/formic acid (FA), 100/0.1 (v/v)) and analyzed by online C18 nano-HPLC MS/MS, coupling an UltiMate 3000 gradient HPLC system (Thermo Fisher) and an Orbitrap Exploris 480 mass spectrometer (Thermo Fisher). A total of 12 fractions were injected onto a precolumn (300 μm × 5 mm; PepMap100 C18 5 μm, Thermo Fisher) equilibrated with solvent A and eluted via a homemade analytical nano-HPLC column (50 cm × 75 μm; ReproSil-Pur C18-AQ 1.9 μm) using solvent B (80/20/0.1 (v/v/v) ACN/water/FA) in a gradient from 5 to 30% in 160 min. The nano-HPLC column was drawn to a tip of ∼5 μm and functioned as an electrospray needle. A Sonation PRSO-V2 column oven was used to maintain the analytical column temperature at 50 °C. The MS1 spectra were recorded in the Orbitrap at a mass-to-charge ratio (m/z) range of 350–1,600, a resolution of 120,000, a maximum injection time of 50 ms, and automatic gain control (AGC) at standard. Dynamic exclusion was applied after n = 1 with an exclusion duration of 45 s and a mass tolerance of 10 ppm. Charge states 2–5 were included. Precursors for MS2 were selected using a TopSpeed method of 3 s at a resolution of 45,000 and fragmented by high-energy collision-induced dissociation (HCD) at a normalized collision energy (NCE) of 36%, with an AGC at 200 and the maximum injection time set to auto. The isolation window for MS/MS was 1.2 Da.
Raw data files were converted to the peak list by using Proteome Discoverer v2.4 (Thermo Fisher), followed by protein identification employing the UniProtKB database (Homo sapiens, 20,596 entries) using Mascot v2.2.07 (Matrix Science Inc., Boston, MA/USA) with the following parameters: precursor and fragment mass tolerances of 10 ppm and 0.02 Da, respectively; TMT16plex on N-term and Lys as fixed modifications; oxidation on Met and acetylation of N-term as variable modifications; and full tryptic digestion (no P rule) with up to 2 missed cleavages. A false discovery rate (FDR) of 1% was set for peptide spectrum matches (PSMs), peptides, and proteins.
The MS data have been deposited via the PRIDE partner repository to the ProteomeXchange Consortium with the identifier PXD040003.
Results
Quantification and Size Distribution of Isolated Vesicle Fractions
To assess the yield and size distribution of vesicles isolated by different methods, nanoparticle tracking analysis (NTA) was employed. The SCF procedure yielded the highest median number of vesicles per cell (2,356.3 ± 7,461.7; median ± range), followed by gradient-based (1,630.2 ± 1632.3), filter-based (228.2 ± 265.6), and bead-based isolation (27.8 ± 35.2). Both filter- and bead-based approaches resulted in significantly lower yields compared to SCF (p-value = 0.002 and p-value <0.0001, respectively), and the gradient-based method yielded significantly more vesicles than the bead-based approach (p-value = 0.002; Figure 1A).
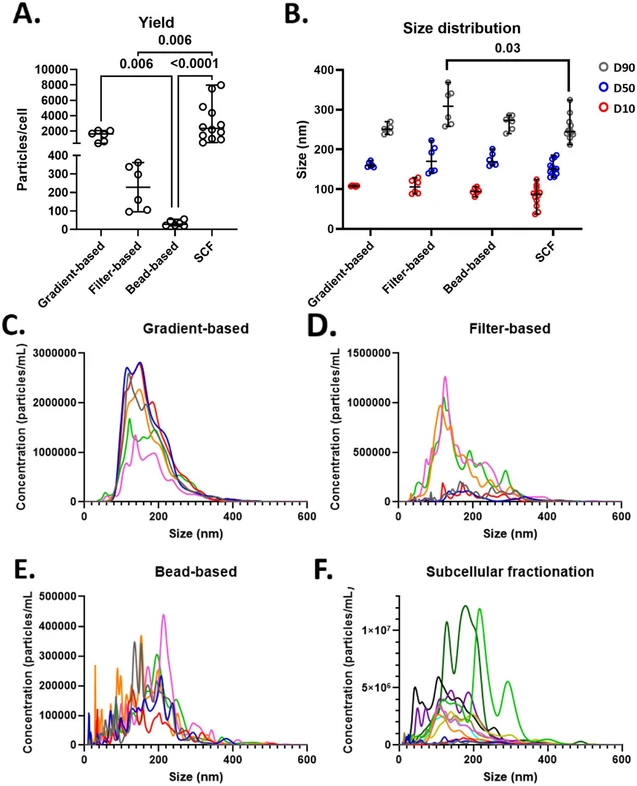 Anal. Chem. 2026, 98, 6, 4585–4600: Figure 1. Quantification and size analyses of isolated vesicles. A) Quantification of isolated vesicles per cell, shown as median with range. Circles represent technical replicates. B) Size distribution of isolated vesicles (in nm), displaying average D10 (red), D50 (blue), and D90 (gray), depicted as median with range. Circles represent technical replicates. C–F) Particle distribution plots showing mean concentration at specific sizes; each line represents a technical replicate. For each method, six technical replicates are shown, except for SCF, which includes 12 replicates. SCF, subcellular fractionation. Statistical significance: p < 0.05 and FDR 5%. For statistical analysis, the nonparametric Kruskal–Wallis test was used and corrected for multiple comparisons using the method of Benjamini and Hochberg.
Median vesicle size (D50) was comparable across all methods: 159.5 ± 17.2 nm (gradient-based), 169.9 ± 82.7 nm (filter-based), 168.9 ± 42.4 nm (bead-based), and 150.0 ± 55.6 nm (SCF). Similarly, decile 10 (D10) values were consistent, ranging from 87.1 ± 87.3 nm (SCF) to 108.2 ± 3.1 nm (gradient-based). However, filter-based isolation led to higher size heterogeneity of the isolated particles, capturing significantly larger vesicles at the upper end (D90:308.5 ± 110.7 nm) compared to SCF (244.9 ± 112.6 nm, p-value = 0.005), while gradient- and bead-based methods showed intermediate D90 values (250.8 ± 31.7 nm and 273.0 ± 45.9 nm, respectively; Figure 1B). Notably, greater intra-assay variation in concentration and size distribution was observed with filter-based and SCF methods compared to the other approaches (Figure 1C–F).
Morphology of the Isolated Fractions
Transmission electron microscopy (TEM) of the isolated fractions confirmed the presence of heterogeneously sized vesicles, in line with the size distributions obtained by NTA. Notably, only the gradient-based method yielded relatively pure vesicle preparations. In contrast, filter-based and SCF methods displayed contamination with cellular debris or protein aggregates, while the bead-based approach was associated with the presence of lipid structures (Figure 2).
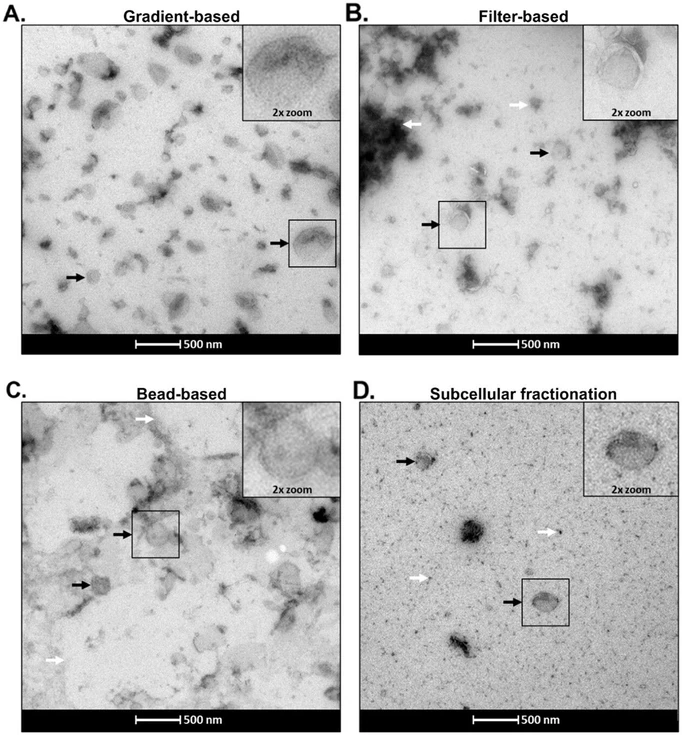 Anal. Chem. 2026, 98, 6, 4585–4600: Figure 2. Transmission electron microscopy (TEM) of isolated fractions. Panels A–D show TEM images of the four isolated fractions. Insets display magnified views of the regions outlined in black squares. Black arrows indicate identified representative isolated vesicles, and white arrows denote areas of contamination.
Conclusion
This study provides a systematic benchmarking of four lysosome isolation strategies, revealing inherent trade-offs among yield, integrity, purity, and reproducibility driven by their underlying separation principles. No single method is universally optimal; instead, the method selection must be guided by the intended downstream application. By integrating complementary analytical approaches in a clinically relevant and challenging monocytic model, our work offers a practical framework to support the informed selection of lysosome enrichment strategies, facilitating reliable lysosomal analyses in both research and translational settings.