Exploring Domestic Discharge Patterns in Wastewater through LC-HRMS Screening and Temporal Clustering
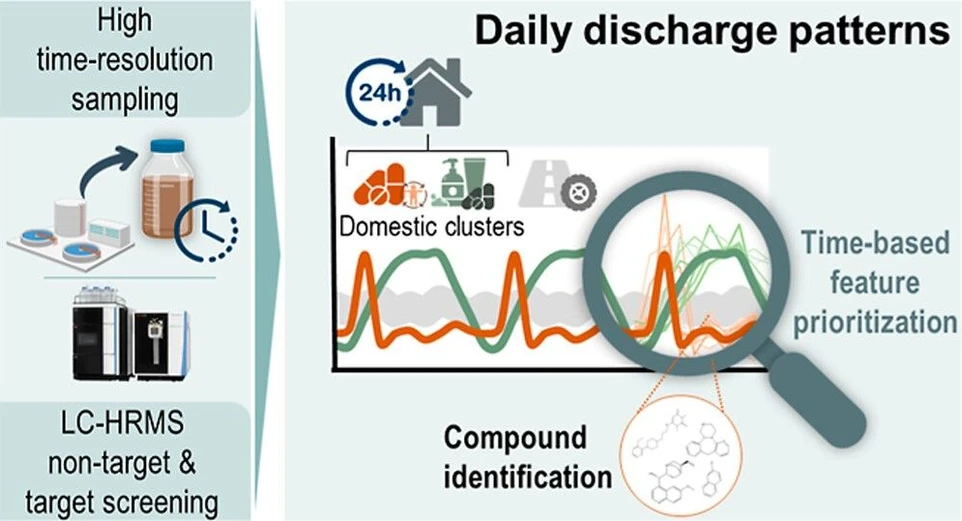
Environ. Sci. Technol. 2025, 59, 29, 15375–15384: Graphical abstract
Wastewater influent contains valuable information on population-level chemical exposure, but the complexity of the matrix complicates data interpretation. This study investigates daily discharge patterns of trace organic compounds in influent wastewater to identify recurring trends linked to domestic chemical use.
Hourly composite samples collected over three 24-hour periods were analyzed using LC-HRMS with targeted and non-targeted screening, yielding over 72,000 features and 402 annotated target compounds. Temporal k-means clustering revealed five distinct daily patterns, including two associated with domestic activities—one correlated with wastewater flow and another showing a characteristic morning peak likely linked to urine excretion. Applying these patterns to non-target data prioritized additional features with similar temporal behavior, demonstrating the value of combining LC-HRMS screening with clustering approaches to elucidate wastewater discharge dynamics and population exposure.
The original article
Exploring Domestic Discharge Patterns in Wastewater through LC-HRMS Screening and Temporal Clustering
Inga Haalck*, Martin Krauss, Werner Brack, and Carolin Huber
Environ. Sci. Technol. 2025, 59, 29, 15375–15384
https://doi.org/10.1021/acs.est.5c02486
licensed under CC-BY 4.0
Selected sections from the article follow. Formats and hyperlinks were adapted from the original.
Wastewater influent contains valuable epidemiological information on a community level, which is of interest for new monitoring tools such as wastewater-based epidemiology (WBE) or wastewater-based surveillance (WBS). Here, various information, such as population’s pharmaceutical (1,2) and illicit drug (3−5) use, diet, (6) virus prevalence, (7) or exposure (8−10) can be retrieved from wastewater. The approach is based on the analysis of human excretion products (biomarkers), (11) thus focusing on the urinary and/or fecal fraction of wastewater.
However, the chemical mixture found in influent wastewater is very complex, including not only domestic contributions, such as human excretion products, but also other inputs, such as industrial effluents or surface runoff. This complexity not only increases analytical challenges, but also complicates data interpretation and the link of results to human consumption and exposure. (12,13) Especially for compounds not intended for human consumption, distinguishing human urinary metabolites from other transformation products formed prior to exposure or in the sewer system is often challenging, but it would be necessary to fully confirm internal exposure and achieve an accurate exposure assessment through WBE. (13)
Pinpointing those compounds in wastewater stemming exclusively from domestic activities (e.g., urination and defecation, showering, among others) may serve as a useful first step in separating WBE-relevant features from other contributing sources. The analysis of daily discharge patterns in influent wastewater may enhance the understanding of chemical source profiles, allowing the identification of the link between chemicals and specific activities. Therefore, we hypothesize that compounds originating from the same source would exhibit the same daily discharge pattern and could be grouped accordingly. Using known chemicals with a known source as a reference, this temporal co-occurrence could then provide valuable indications for chemicals with an unknown source. For instance, evaluating the pattern of compounds known to be excreted by humans (e.g., pharmaceutical metabolites) might provide a strong indication of human internal exposure to other temporally co-occurring compounds.
Temporal trend analysis has already been applied in several studies, such as assessing water contamination dynamics, (14−17) as early warning system for newly emerging contaminants (18) or spill detection. (19) Additionally, evaluating the dynamics of chemicals revealed in several cases valuable information regarding the source and origin of contaminants in surface water (20) or wastewater. (21,22)
This study aims to analyze daily discharge patterns in influent wastewater to identify recurring patterns for compounds, particularly those from domestic sources, isolating one contributing factor for human exposure and gaining in-depth insights into discharge dynamics. Hourly composite influent samples from a medium-sized wastewater treatment plant (WWTP) were taken for 24 hours on a typical working day, with 3 days as replicates. With targeted and non-targeted LC-HRMS screening combined with clustering methods, we explored discharge patterns of known compounds, and subsequently prioritized non-targeted features exhibiting the same patterns of interest.
2. Methods and Materials
2.3. Sample Extraction and Chemical Analysis
The sample extraction procedure included filtration, followed by solid phase extraction (SPE) with a Chromabond HR-X (Macherey-Nagel) sorbent and is fully described in Supporting Information, Section S2. A mixture of internal standards (IS) (Supporting Information, Table SX3) was added after reconstitution for quality control of the analysis and data processing to compensate for matrix effect differences among samples and calibration standards for the quantification. The analysis was performed on a Vanquish HPLC system (Thermo Scientific) coupled to a quadrupole-Orbitrap instrument (Exploris 480, Thermo Scientific) operated in positive and negative electrospray ionization mode (ESI+/ESI-) acquiring MS1 and MS2 information using Top-8 data-dependent (dd) acquisition. Further details on the chromatographic system and the settings of the mass spectrometer can be found in Supporting Information, Section S3 and Table S3.
In every sample batch (1 day), procedure blanks (LC–MS grade water) and two spiked LC-grade water samples at two levels (200 ng/L and 5 μg/L) were extracted and measured within the sequence. Additionally, 24-h composite samples of each day spiked with two levels (200 ng/L and 5 μg/L) were included as quality control (QC). The blanks and QC samples were spiked with the same IS mixture as the samples (Supporting Information, Table SX3). The samples were analyzed in a randomized order and solvent blanks were injected every 12 samples to monitor for potential carryover. The QA/QC samples, along with 12 of the hourly samples were measured twice to assess the analytical reproducibility. The results of the QC can be found in Supporting Information, Section S4 and Figures S1–S3. Before the first sampling campaign, field blanks (n = 2) were taken at the WWTP with tap water using the same sampling device.
3. Results and Discussion
3.2. Temporal Clustering of Target Compounds
First, the cluster analysis was tested on both, target compounds and all non-targeted features. The unsupervised clustering of the non-targeted features revealed some difficulties in the interpretation of meaningful patterns due to the absence of a prior relevance-based prioritization of the features in relation to the research question. In addition, compounds with a high potential for adduct or fragment formation or multiple co-occurring congeners (e.g., surfactants) might dominate the clustering result, potentially obscuring more relevant patterns. Thus, clustering of the target compounds, selected to reflect the urban environment, provided a clearer picture.
The range of variation in signal intensities of the IS was 13–30% in ESI+ (n = 22) and 23–28% in ESI– (n = 3). Therefore, only features with a variation >45% were considered, focusing on temporal trends that exceed potential technical shifts in sensitivity or differences in matrix effects (Supporting Information, Figures S2 and S3). Further evaluation of the total ion chromatogram between the hourly samples supported the assumption that, for this case study, there was no significant shift in matrix composition or matrix effects over the course of the day that could bias the cluster analysis. However, this may differ at different sample sites, where additional corrections (e.g., normalization with IS or postcolumn infusion of a reference) may be necessary.
Different data treatment strategies for clustering of the target compounds were also explored. The evaluation summary and reasoning for choosing to cluster the data set as one 72-h continuous period can be found in Supporting Information, Section S7 and Figures S7–S13.
3.2.1. Observed Temporal Trends
Based on the reasons given in the previous section and Section S7, 95 prioritized target compounds were further analyzed in-depth in the selected cluster analysis. A total of 90 target compounds showed a probability of belonging to their assigned clusters greater than 90%. Figure 2A summarizes the modeled GAMs for each cluster and day, combined with the flow rate measured at the WWTP. The full list of target cluster assignments can be found in Supporting Information, Tables SX1–2. Normalizing signal intensities by flow rate before cluster analysis revealed similar trends to those without normalization but tended to overshadow the temporal patterns of some target compounds (Supporting Information, Figure S11). Hence, we tended for the interpretation without normalization.
![Environ. Sci. Technol. 2025, 59, 29, 15375–15384: Figure 2. (A) Temporal trends of the identified clusters (bottom) and influent flow rate (top) for three replicate sampling days. The starting point of the sampling is indicated by the gray dashed line. (B) Compound classes of the annotated target compounds in each cluster (DA: daytime activity, MP: morning peak, BG [1–3]: background patterns).](https://lcms.labrulez.com/labrulez-bucket-strapi-h3hsga3/Environ_Sci_Technol_2025_59_29_15375_15384_Figure_2_A_Temporal_trends_of_the_identified_clusters_bottom_and_influent_flow_rate_top_for_three_replicate_sampling_day_7c04e3bddd_l.webp) Environ. Sci. Technol. 2025, 59, 29, 15375–15384: Figure 2. (A) Temporal trends of the identified clusters (bottom) and influent flow rate (top) for three replicate sampling days. The starting point of the sampling is indicated by the gray dashed line. (B) Compound classes of the annotated target compounds in each cluster (DA: daytime activity, MP: morning peak, BG [1–3]: background patterns).
Environ. Sci. Technol. 2025, 59, 29, 15375–15384: Figure 2. (A) Temporal trends of the identified clusters (bottom) and influent flow rate (top) for three replicate sampling days. The starting point of the sampling is indicated by the gray dashed line. (B) Compound classes of the annotated target compounds in each cluster (DA: daytime activity, MP: morning peak, BG [1–3]: background patterns).
3.3. Cluster Assignment of Non-targeted Features
In a next step, an assignment of the non-targeted features to the identified clusters was predicted. After filtering based on detection frequency (DF > 85%) and temporal variation (RSD > 45%), the final inclusion list for the cluster prediction contained 22,589 features, including also the annotated 90 target compounds (Supporting Information, Figure S15).
The Euclidean distance of each non-targeted feature to the centroids of the clusters was calculated at each time point (n = 72) and summed up to determine the overall closest cluster for each feature. The prioritization described in Section 2.6 reduced the feature list by more than 80% to 3,757 features (Supporting Information, Figure S16). To illustrate the underlying data and the concept of relative distances applied during both cluster analysis and cluster prediction, Figure 3A presents the three closest target compounds for the MP and DA cluster. As all prioritized target compounds were still in the feature list, their correct assignment to their original cluster during the cluster prediction was used as a quality control for the method.
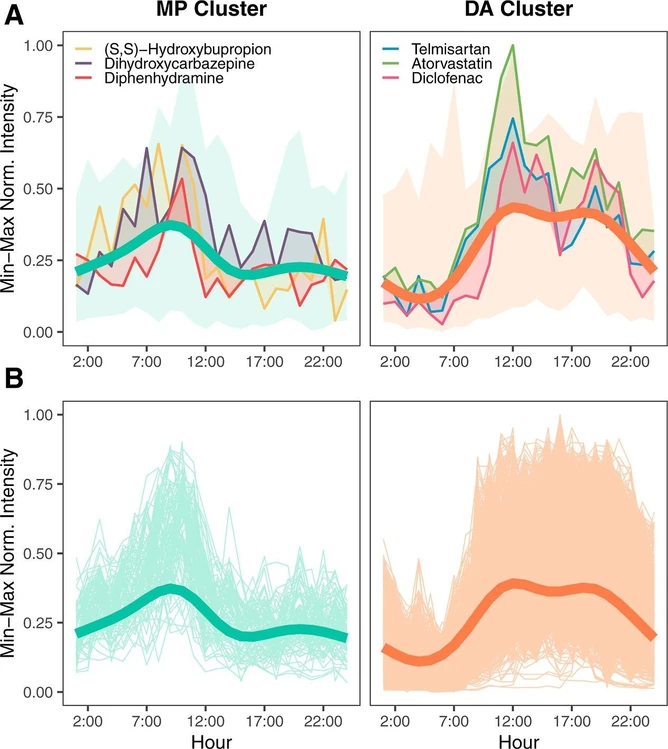 Environ. Sci. Technol. 2025, 59, 29, 15375–15384: Figure 3. Temporal patterns of to the morning peak (MP) and daytime activities (DA) clusters: (A) The three closest target compounds highlighted in front of the variation of the target compounds. (B) Non-targeted features assigned to each cluster. The thick lines in (A) and (B) illustrate the GAM predictions averaged across three sampling days (see Figure S14 for other clusters).
Excluding the target compounds, a total of 1,133 features were assigned to cluster DA, while 70 features were assigned to the MP cluster. The remaining features were distributed among the background clusters (BG1: 1,868 features, BG2: 585 features, BG3: 11 features).
As seen in Figure 3B, with the use of the Euclidean distance, non-targeted features were successfully prioritized and matched to the previously established daily patterns (further visualization for all other clusters, see Supporting Information, Figure S17).
3.6. Implications and Future Applications
Wastewater is a valuable source of epidemiological information; however, its complex matrix exacerbates extracting meaningful results and the link to population exposure. By studying the daily discharge patterns, this study offers insights into chemical discharge profiles of different sources (e.g., domestic vs. road runoff), making this approach valuable for chemical source identification. Additionally, the results demonstrate the advantages of high-time resolution sampling, as by avoiding dilution, we could find more compounds and higher maximum concentrations in the hourly samples compared to the 24-h composite samples.
We demonstrate the presence of reproducible and recurring daily patterns, pinpointing two patterns associated with domestic use: one representing general daytime activities and another with a closer connection to human metabolism. The majority of compounds in the latter cluster are associated with pharmaceutical use, which facilitated the assessment of whether these compounds had passed through the human body, enabling the association to (morning) urine. We propose this discrimination as a beneficial tool for monitoring approaches such as WBE, providing additional evidence about the origin of a potential biomarker and supporting the interpretation of other compounds related to human metabolism (e.g., endogenous compounds used for population normalization or to confirm the presence of human excretion), and making conclusions more meaningful. However, in this pilot study, only pharmaceuticals represent chemicals intended for consumption, while WBE is currently seeking to include a wider range of chemicals related to unintentional exposure. (49) To include them, comparing the temporal patterns and cluster assignments of parent compounds and their human-specific metabolites could provide a more precise understanding of their internal exposure profile, helping to confirm that their source is exclusively related to human exposure. (50)