News from LabRulezLCMS Library - Week 29, 2026
LabRulez: News from LabRulezLCMS Library - Week 29, 2026
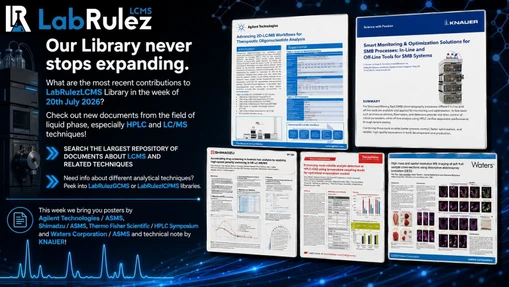
Our Library never stops expanding. What are the most recent contributions to LabRulezLCMS Library in the week of 13th July 2026? Check out new documents from the field of liquid phase, especially HPLC and LC/MS techniques!
👉 SEARCH THE LARGEST REPOSITORY OF DOCUMENTS ABOUT LCMS AND RELATED TECHNIQUES
👉 Need info about different analytical techniques? Peek into LabRulezGCMS or LabRulezICPMS libraries.
This week we bring you posters by Agilent Technologies / ASMS, Shimadzu / ASMS, Thermo Fisher Scientific / HPLC Symposium and Waters Corporation / HPLC Symposium and technical note by KNAUER!
1. Agilent Technologies / ASMS: Intact Protein Analysis in Plasma Using Automated 2D-LC/TOF with Multiple Heart-Cutting
- Poster
- Full PDF for download
Direct intact and top-down protein analysis enables comprehensive characterization of proteoforms, post-translational modifications, and fragments that are often lost in bottom-up workflows.1 However, intact mass analysis in complex biological matrices such as whole plasma is challenged by extreme dynamic range and ion suppression, commonly necessitating affinity-based enrichment.
Here, we demonstrate a non-affinity, orthogonal separation strategy using a 2D-LC/TOF workflow with multi-heart-cutting for native intact protein analysis directly in plasma. Therapeutic monoclonal antibodies (mAbs) trastuzumab and antibody-drug conjugate T-DM1, were used as model systems to evaluate performance.
The workflow employs an Agilent 1290 Infinity III 2D-LC system for orthogonal separations and precise multiple heart-cutting, coupled to a high-resolution, high-sensitivity Agilent 6230C Accurate Mass TOF LC/MS System.
Experimental
Instrumentation
- Agilent 1290 Infinity III 2D-LC system comprised the following modules:
- 1290 Infinity III Bio Multisampler with Thermostat (G7137A)
- 1290 Infinity III Multicolumn Thermostat (G7116B)
- 1290 Infinity III Diode Array Detector (G7117B) with Max-Light cartridge cell (G7117-60020)
- 1260 Infinity III Bio Flexible Pump (G7131C)
- 1290 Infinity III Bio High-speed Pump (G7132A)
- 1290 Infinity Valve Drive (G1170A) with 2D-LC ASM Valve (G5643B)
- Two 1290 Infinity III Valve Drives (G1170A) with multiple heart-cutting valves (G5642-64000) equipped with 40 µL Bio loops
- 1290 Infinity III Valve Drive (G1170A) with a 2- position/6-port valve (G4231A) (used as a diverter valve)
- Agilent 6230C Accurate Mass TOF LC/MS System
LC/MS Analysis
Data acquisition and analysis were carried out using MassHunter acquisition (12.2), BioConfirm (12.1) and MassHunter Qualitative Analysis (13.0) software.
Conclusions
- Agilent 2D-LC enables direct native MS analysis of intact proteins from plasma without affinity-based enrichment.
- UV-guided and multiple heart-cutting simplify 2D-LC method development and provide high-resolution isolation of native proteins from complex biological matrices such as plasma.
- The Agilent 6230C Accurate Mass TOF delivers high sensitivity and excellent mass accuracy, enabling confident intact protein characterization under native conditions.
2. KNAUER: Mind the pressure in preparative up-scaling – effects of particle size and solvent composition on back pressure
- Technical note
- Full PDF for download
The back pressure of a chromatographic system is generated by the system components, the capillaries, the column, the solvent, and the applied flow rate. Each system has a maximum pressure which it can sustain, and therefore the pressure must be monitored as it is a limiting factor during method development. The back pressure generated by a column is dependent on the particle size and its length. The development of a preparative method is ideally performed on an analytical scale and after optimization the method is then scaled up to preparative scale.
As preparative HPLC systems normally have lower maximum pressures, it is important to keep the generated pressure in the range of the later preparative system.
The larger the particles of the column material are, the lower will be the generated back pressure. With increasing particle size, the resolution is decreasing at the same time. Depending on the separation task, the resolution can be a critical point, and it is important to find the right compromise between resolution and backpressure. Additionally, larger particles are significantly less price intensive, which is another factor to be considered especially for large scale purifications. Often solvent mixtures of water with acetonitrile, methanol or ethanol are used for reverse phased methods. Depending on the organic solvent composition, the generated back pressure differs significantly which could be reduced by changing the solvent composition slightly or the organic solvent if possible. The back pressure generated by the solvent will not or only slightly change during the up-scaling process.
Here, the influence of particle size, flow rate and solvent composition on the back pressure was evaluated. Further, a practical scale-up was performed to evaluate the values obtained on analytical scale to those in larger scale.
User Tips:
- What is the finale scale you want to operate later?
- What are the pressure limitations of the preparative system?
- Be aware of the solvent back pressure
- Consider particle size not only for best separation
- Consider the flow rate
MATERIAL AND METHODS
- Pump: AZURA® P 6.1LHPG, 10 ml, sst
- Autosampler: AZURA AS 6.1L
- Detector: UV AZURA DAD 2.1L
- Flow cell: Pressure proof 10 mm, 10 µl, 300 bar
- Thermostat: CT2.1
- Columns:
- Eurospher II 100-5 C18, 150 x 4.6 mm
- Eurospher II 100-10 C18, 150 x 4.6 mm
- Eurospher II 100-15 C18, 150 x 4.6 mm
- Eurospher II 100-20/45 C18, 150 x 4.6 mm
- Software
- ClarityChrom 10.1
- ClarityChrom 10.1 PDA extension
CONCLUSION
The back pressures of four C18 150 x 4.6 mm columns, which differed only in particle size were measured and compared at different flow rates and solvent compositions. As expected, the 5 µm column showed the highest and the 20/45 µm column the lowest back pressure at all tested conditions. The pressure curves of ethanol and methanol gradients were similar, with a maximum pressure at approximately 50% solvent. The pressure curve of the acetonitrile gradient differed from the other two, showing the highest pressure at a lower organic solvent content of approximately 35%, after which the pressure dropped. Ethanol showed the highest pressure, followed by methanol and then acetonitrile. Determining the column back pressure at an analytical scale is an important tool during preparative method development. Ideally, if a linear scale up from the analytical to the preparative scale is conducted, the column back pressure should stay the same. This helps to predict if the method can be scaled up to the desired size in terms of back pressure.
3. Shimadzu / ASMS: Enhanced Quantification of Emerging UV Filter Contaminants in Drinking Water Using Optimized LC-MS/MS Technique
- Poster
- Full PDF for download
Ultraviolet (UV) filter chemicals from sunscreens and personal care products are increasingly recognized as emerging contaminants of concern in drinking water1 . Their persistence and reported biological effects highlight the need for sensitive and reliable monitoring approaches2 . The objectives were to optimize quantitation to achieve ppt level detection without offline extraction and assess the occurrence of these compounds in multiple drinking water matrices. In this study, 20 UV filters were analyzed using a Shimadzu LCMS8060RX triple quadrupole mass spectrometer.
Conclusion
A highly sensitive, precise, and robust direct injection LC–MS/MS method enables sub-ppt to high-ppb quantification of 20 UV filters in drinking water. Overall, the highly sensitive and robust Shimadzu LCMS-8060RX Triple Quadrupole Mass Spectrometer combined with this extraction-free workflow provides a simple, reliable, and high-throughput approach for quantifying emerging UV filters at ng/L concentrations in drinking water.
4. Thermo Fisher Scientific / HPLC Symposium: Comparison of biocompatible and inert UHPLC systems for LC-UV quantitation of large RNA
- Poster
- Full PDF for download
Accurate LC-UV analysis of large RNA and oligonucleotide therapeutics requires highly inert chromatographic flow paths because interactions between the negatively charged phosphodiester backbone and metallic surfaces can cause analyte loss, peak broadening, and reduced quantitative sensitivity, particularly at low concentration.
Here, an inert UHPLC system – Vanquish Amplify system, incorporating inert-coated flow path components was evaluated against a biocompatible UHPLC configuration using MP35N alloy capillaries and additionally against a commercially available inert UHPLC platform. Large RNA fragments of 500 and 5000 nucleotides were analyzed by IP-RPLC to assess the difference between these systems. To further investigate flow path interactions, adenosine 5′- (α,β-methylene) diphosphate (AMPcP), a metal-sensitive analyte, was analyzed alongside adenosine, a noninteracting reference compound.
Material and Methods
- Instrumentation: Thermo Scientific Vanquish Amplify UHPLC system
- Column: Thermo Scientific SurePac Oligo RP MDi HPLC column,
2.5 µm 2.1 X 50 mm (P/N: 43712-052132 - Data Analysis: The Thermo Scientific Chromeleon Software 7.3.2 MUc Chromatography Data System (CDS) was used for all data acquisition and analysis.
Conclusions
Using AMPcP with the Vanquish Amplify system demonstrated up to a twofold increase in sensitivity compared to systems with MP35N fluidics under conditions where metal interactions are most pronounced
For large RNA, the Vanquish Amplify UHPLC system delivered 1.25–1.35× higher signal intensity compared to systems with MP35N fluidics, enabling reduced sample consumption and improved quantitative reliability.
The Vanquish Amplify UHPLC system demonstrated comparable system inertness under the tested conditions for larger RNA fragments (5,000 nt) and slightly better system inertness for smaller fragments (500 nt) in this study than the MaxPeak HPS containing system, based on peak height and area comparisons using an external UV detector
5. Waters Corporation / HPLC Symposium: Development and Transfer of Quantitative Analytical Methods using Universal Detectors
- Poster
- Full PDF for download
Universal detectors such as Charged Aerosol Detection (CAD) and Evaporative Light Scattering Detection (ELSD) provide valuable alternatives to traditional LC detectors including UV, fluorescence, and mass spectrometry, particularly for analytes lacking chromophores. Although both detectors are suitable for quantitative analysis, they rely on different detection principles—CAD measures the electrical charge transferred to aerosol particles, whereas ELSD detects light scattered by dried analyte particles. Because both detectors exhibit non-linear responses, quantitative methods typically require calibration models such as log-log linear or quadratic regression rather than conventional linear calibration. The poster discusses key considerations for developing robust quantitative methods and highlights the challenges associated with transferring methods between different universal detection platforms.
To demonstrate detector transferability, the authors migrated a HILIC method for sugar analysis in fruit juice from ELSD to CAD. The separation was performed on a Waters Arc HPLC System equipped with an XBridge BEH Amide (4.6 × 150 mm, 2.5 μm) column using a water/acetonitrile gradient containing triethylamine. While the chromatographic conditions remained unchanged, CAD detector parameters were optimized. Both detectors produced highly comparable quantitative performance across a calibration range of 50–1000 μg/mL, achieving calibration coefficients (R²) above 0.995, area RSD values below 1.5%, and nearly identical concentrations of fructose, sorbitol, glucose, and sucrose in an apple juice sample. These results demonstrate that quantitative HILIC methods can be successfully transferred between ELSD and CAD with only detector-specific optimization.
The poster also evaluates method transfer between different CAD platforms using the USP Deoxycholic Acid assay. The method was implemented on a Waters ACQUITY UPLC H-Class PLUS System with an XBridge BEH C18 (4.6 × 150 mm, 3.5 μm) column and compared against a competing LC/CAD system. After scaling the method according to USP Chapter <621>, both systems met all USP system suitability requirements, including repeatability and signal-to-noise criteria. Quantitative results for deoxycholic acid and related impurities were virtually identical, confirming that validated CAD methods can be reliably transferred between different vendors' LC/CAD platforms without compromising analytical performance.
Overall, the study demonstrates that both ELSD and CAD are robust universal detection techniques for quantitative liquid chromatography. While method transfer between identical detector types is generally straightforward, successful migration between ELSD and CAD—or between different CAD systems—requires careful optimization of detector parameters while preserving chromatographic conditions. The presented workflows illustrate that with appropriate calibration and detector tuning, laboratories can achieve equivalent sensitivity, precision, and quantitative accuracy, facilitating method standardization and transfer across analytical platforms.